


Sarcoidosis is a rare inflammatory disease characterized by the presence of granulomas in different organs.1,2 The etiology of sarcoidosis is unknown but is thought to be related to various environmental exposures in genetically predisposed individuals.3 Disease occurs more commonly in females and African Americans (AA).1 International Classification Disease Codes-10 (ICD-10) for sarcoidosis include D86, unspecified sarcoidosis (D86.9), sarcoidosis of lung (D86.0), sarcoidosis of lymph node (D86.), and sarcoidosis of other sites (D86.8).4 Sarcoidosis most frequently involves the lung, but concomitant extra-pulmonary disease occurs commonly.5,6
Only a few studies have described sarcoidosis mortality in the Unites States. Mirsaeidi and colleagues reported a mortality rate of 2.8/1,000,000, with higher rates observed among women and AA.7 In their study, mortality in women was 1.4 times higher than in men (3.3/1,000,000 versus 2.3/1,000,000 in men) and 12 times higher in AA than in Caucasians (16/1,000,000 versus 1.3/1,000,000).7 More recently, Kearney and colleagues also observed higher mortality in females and AA, and in addition, noted regional variability in mortality in the United States.8 The highest death rates were observed in the South with a mean of 3.7 deaths per 1,000,000 versus 1.6 deaths per 1,000,000 in the West, which recorded the lowest death rates.8 Other studies have also noted this regional variability in sarcoidosis-related mortality.9–12 The reason for this regional variability is unknown but may be related to regional incidence/prevalence of disease,13 occupational/environmental exposures,14 state-level health disparities,10 and other socioeconomic determinants of health and disease.15
Sarcoid-related mortality in North Carolina is higher than the national average (5.4/1,000,000 versus 2.9/1,000,000).8,10 Kearney and colleagues found that only three other states/regions—District of Columbia (13.8/1,000,000), South Carolina (6.6/1,000,000), and Maryland (5.7/1,000,000)—had higher mortality rates.8 Lee and colleagues found that AA in North Carolina had the second highest mortality rates in the nation.10
We evaluated sarcoidosis mortality in North Carolina from 2000 through 2018 to determine regional variability and any association to various sociodemographic variables, occupational/environmental exposures, and air quality as measured by atmospheric levels of fine particulate matter 2.5 microns or smaller in size (PM2.5).
Methods
Study Design and Eligibility Criteria
We adopted a cross-sectional ecological study design with county as the unit of analysis.16 An eligible mortality case was defined as a death in North Carolina from 2000 through 2018 with sarcoidosis listed as the primary or underlying cause of death.
Data and Data Sources
Mortality data were obtained from the Centers for Disease Control and Prevention Wide-ranging Online Data for Epidemiologic Research (CDC WONDER), a national online public database. CDC WONDER derives mortality data from the National Vital Statistics System (NVSS), the United States official repository that maintains all death certificates reported by states, tribes, commonwealths, and territories.
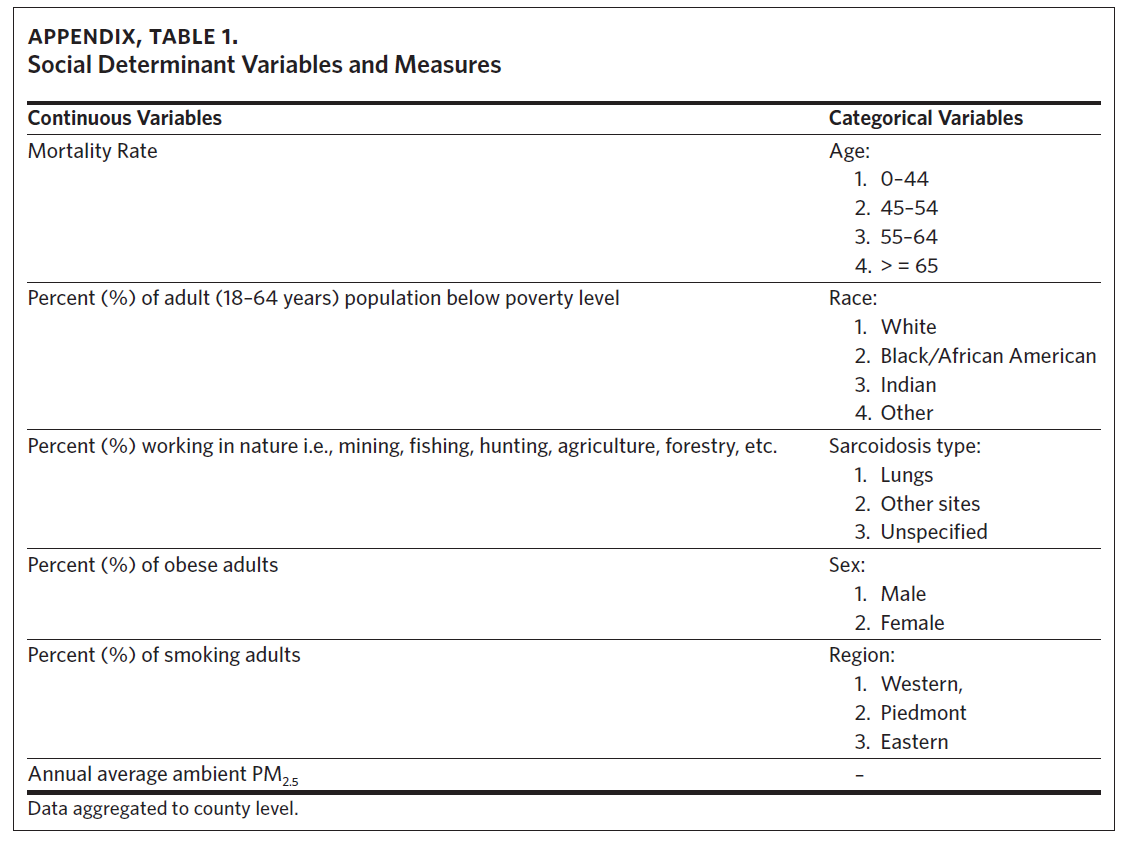
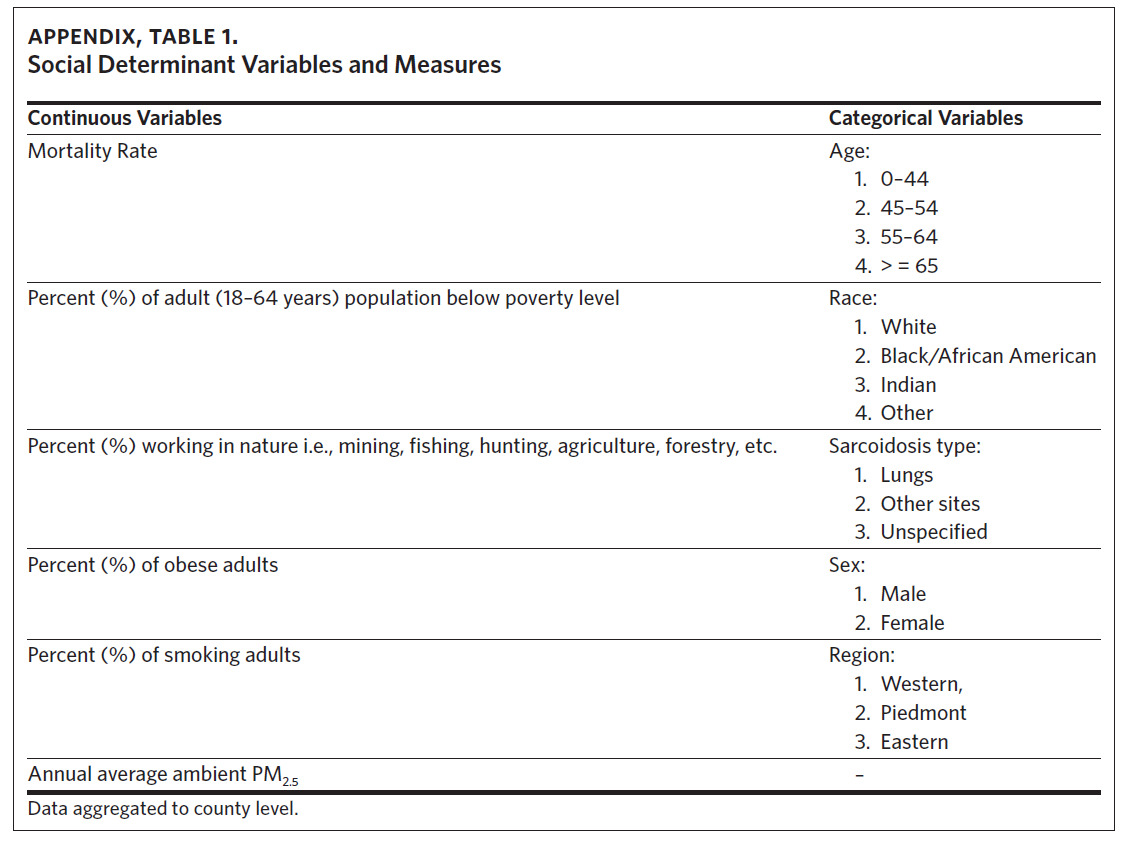
Data on the sociodemographic variables were obtained from the North Carolina Agency for Healthcare Research Quality17 and the Robert Wood Johnson Foundation County Health Ranking & Roadmaps.18 The independent sociodemographic variables selected included percent of AA, population working in nature, (e.g., agriculture, animal farming, mining, fishing, forestry), obese adults, smokers, population below poverty level, and average annual PM2.5. Mortality rate, percent of population working in nature, percent of obese adults, and annual average ambient PM2.5 were treated as continuous variables, while age (0–44, 45–54, 55–64, 65 and older), race (White, Black/African American, native Indian, other) and sarcoidosis type/organ involvement (lungs, other sites, unspecified) were treated as categorical variables (Appendix Table 1). Data on all the sociodemographic and occupational variables were available from 2009 to 2018 except for data on percent of population below poverty level, which were available from 2012–2018.
We postulated that counties with higher proportions of AA would have higher mortality,7,8,11,12 as would counties with higher levels of poverty, obesity, and percent of population working in nature.14,19–22 Smokers are less likely to develop sarcoidosis, however the effect of continued smoking on patients who have sarcoidosis is unknown.23–25 As has been found in other respiratory diseases, we postulated that air quality (as determined by PM2.5) would affect sarcoidosis mortality.26,27
Data Analysis
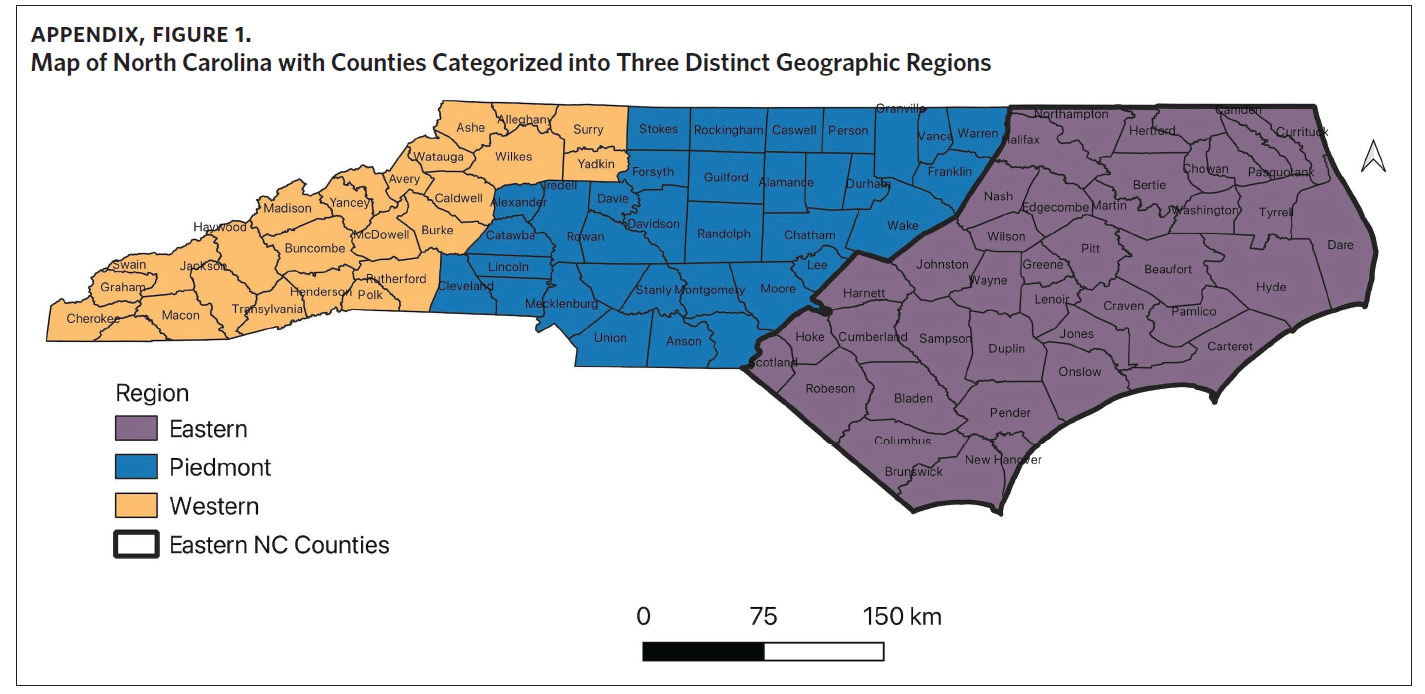
To assess variability of sarcoidosis mortality across North Carolina, counties were categorized into three distinct geographic regions (Western, Piedmont, and Eastern regions) as defined by the State Center for Health Statistics.28 Twenty-four counties make up the Western region; 35 make up the Piedmont; and 41 make up the Eastern region (Appendix Figure 1).28 Cartographic boundary shapefiles were downloaded from the US Census Bureau’s MAF/TIGER database and mortality data was analyzed using R.29
We used descriptive analysis to summarize the numbers of sarcoidosis deaths by race, gender, age category, and sarcoidosis type/organ involvement stratified by region. Mean average values were calculated for each respective risk factor or predictor variable grouping. Fisher’s exact test was used to determine significant differences in sarcoidosis mortality by race, and Pearson’s chi-squared test of independence was used to evaluate statistical differences between observed mortality rates by gender, age category, and sarcoidosis type across the three regions. The Kruskal-Wallis rank sum test was used to explore differences in the regional distribution of sociodemographic risk factors and the Dunn pairwise test with false discovery rate (with P-value adjustment) was conducted to identify regions that differed significantly in the distribution of identified mortality risk factors.
Cluster and outlier analysis utilizing Global and Local Moran’s I was used to assess spatial autocorrelation and to detect sarcoidosis mortality clustering. Contiguity edges and corners (Queens’s contiguity) was used to define neighbors. This technique identifies high-high clusters (counties with high mortality rates surrounded by counties with high mortality rates); low-low clusters (counties with low mortality rates surrounded by counties with low mortality rates), and outliers (counties with high mortality rates surrounded by counties with low mortality rates and vice-versa). Counties that were missing data were disregarded and not used in the analysis.
Multivariate regression analysis was used to evaluate the association between sarcoidosis mortality and sociodemographic risk factors. Histogram plots of raw data and regression diagnostic plots (residuals versus fitted, Q-Q, scale-location, and residuals versus leverage plots) for the model were used to examine the assumptions for the linear regression model. The outcome (crude sarcoidosis mortality rate) and predictor variables met the assumptions for linear regression.
To spatially visualize mortality clustering, we created maps using ArcGIS (Environmental Systems Research Institute, ESRI, Version 10.8.1). A spatial join using NC County field name with NAD83-NC projection was used to create a county-level sarcoidosis mortality shapefile, and choropleth maps were used to demonstrate the spatial distribution of identified risk factors.
P-values < .05 were considered statistically significant for all analysis performed.
Results
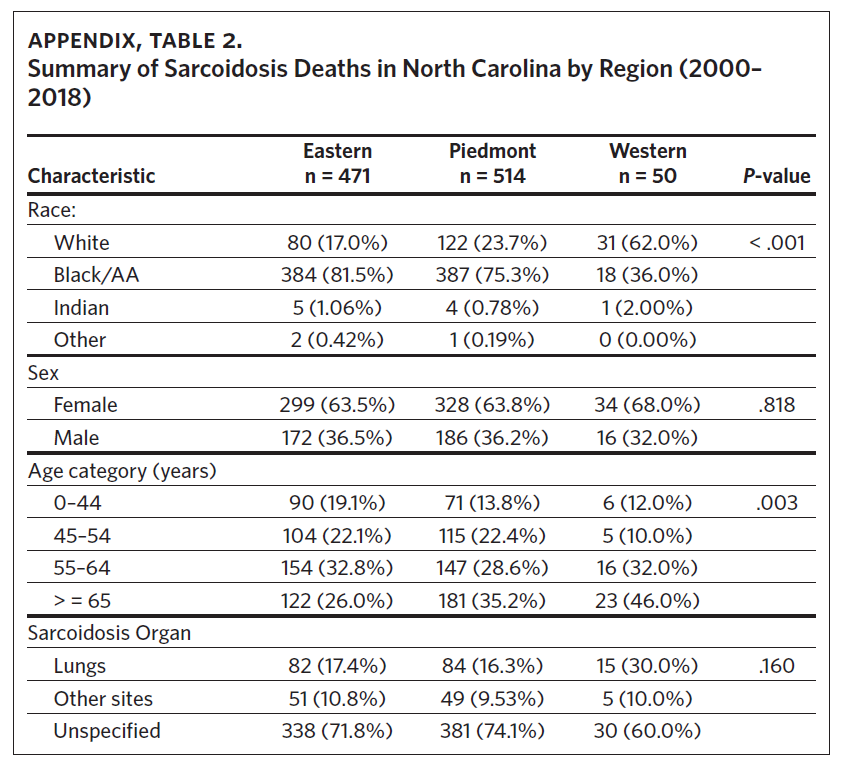
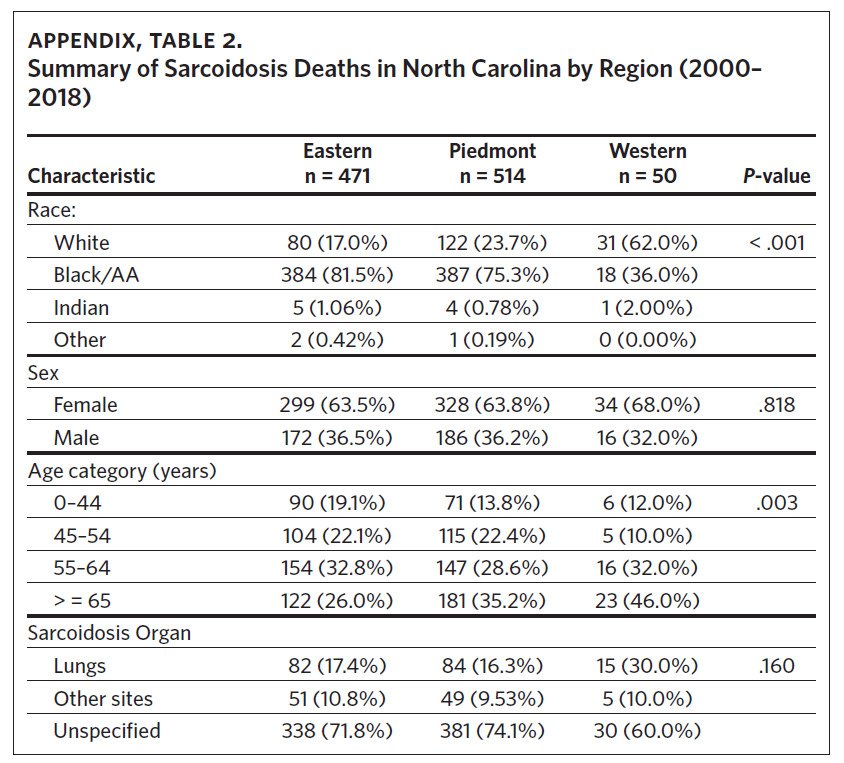
From 2000 through 2018, there were a total of 1,035 sarcoidosis-related deaths across the three regions of North Carolina. Eastern North Carolina (ENC) experienced the highest number of sarcoidosis-related deaths (n = 514), while Western North Carolina recorded the least number (n = 50). In both the Eastern and Piedmont regions, Black/AA accounted for the largest percent of total sarcoidosis-related deaths (81.5% and 75.3%, respectively), while Whites accounted for the largest percent (62.0%) of sarcoidosis deaths in Western North Carolina. Overall, females experienced more sarcoidosis deaths compared to males, and in all the regions sarcoidosis mortality increased with age (highest in those aged 65 years and older) (Appendix Table 2). While most sarcoidosis deaths did not have a specified organ involvement (unspecified), lung was the most common organ specified. The observed differences in mortality rates across the three regions for race and age category were statistically significant (Appendix Table 2).
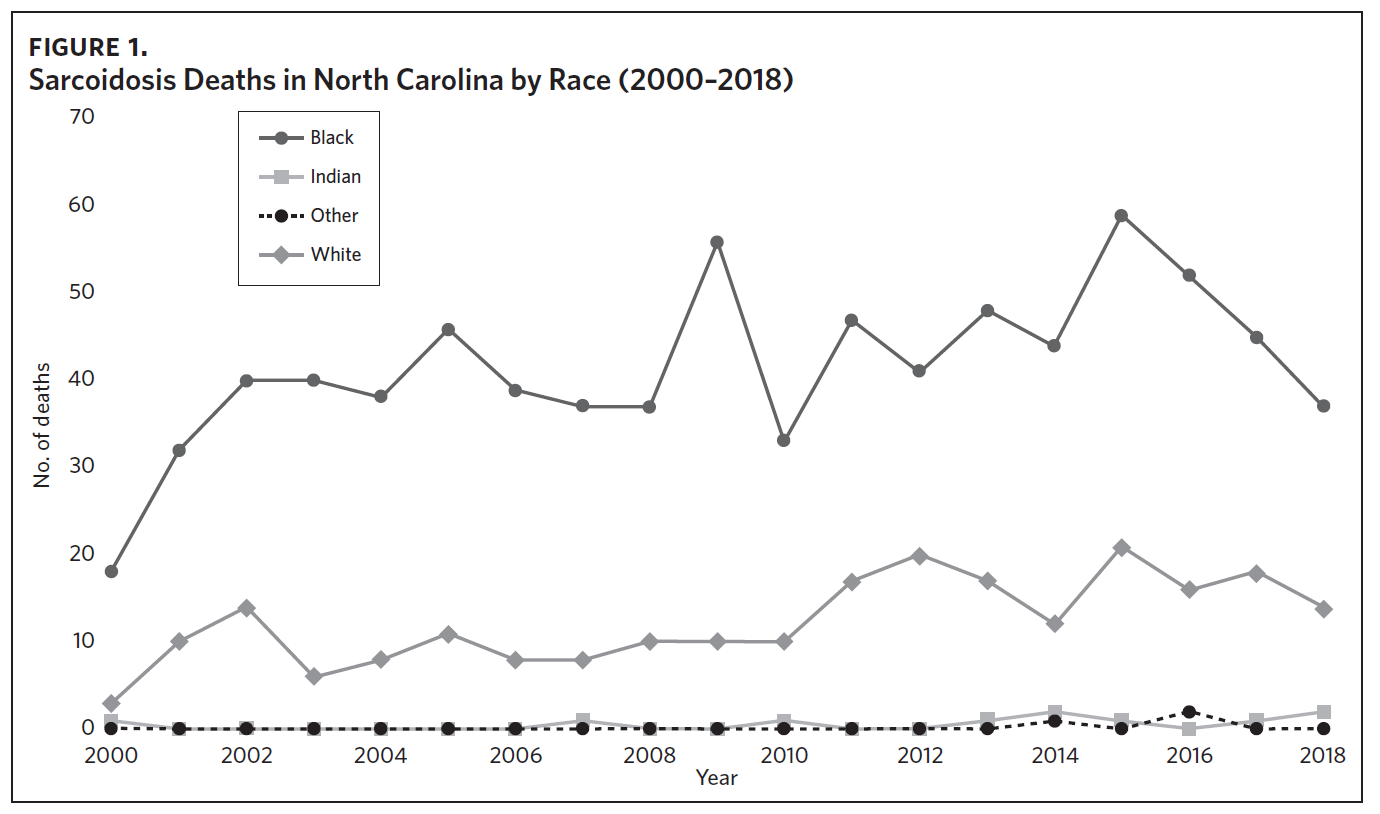
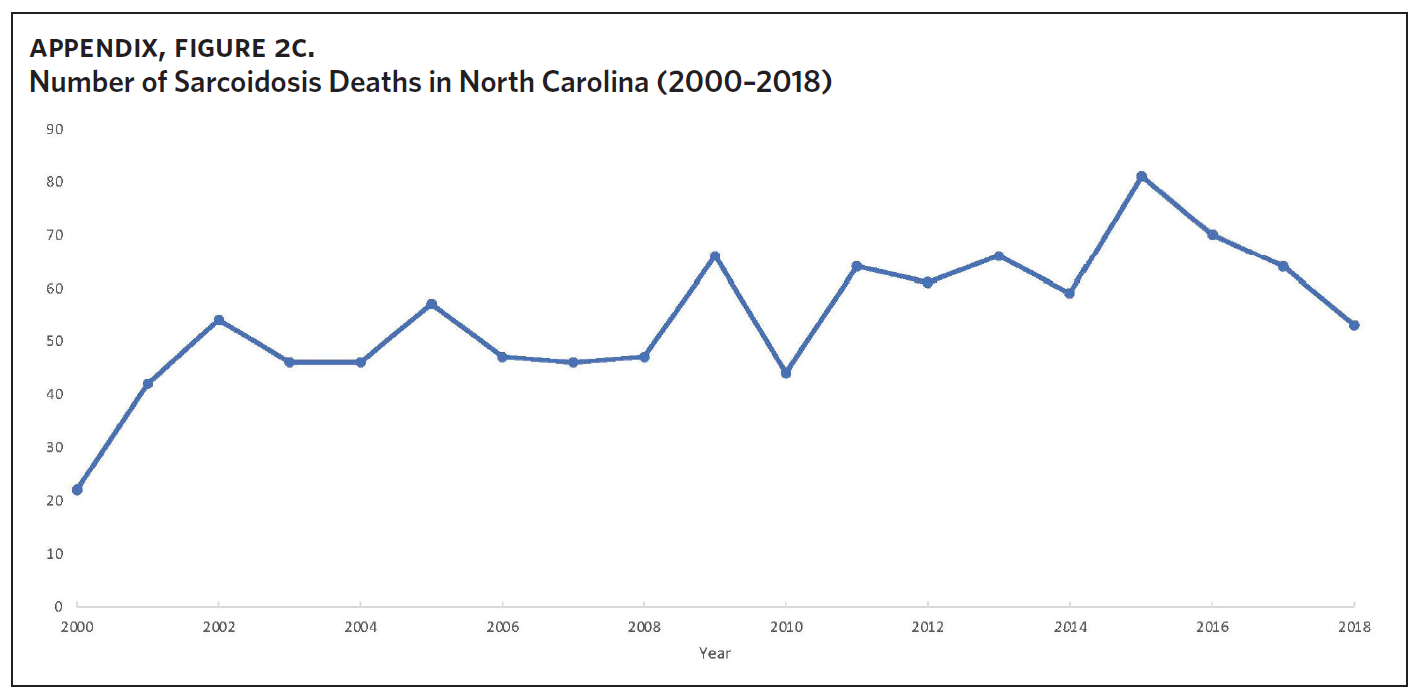
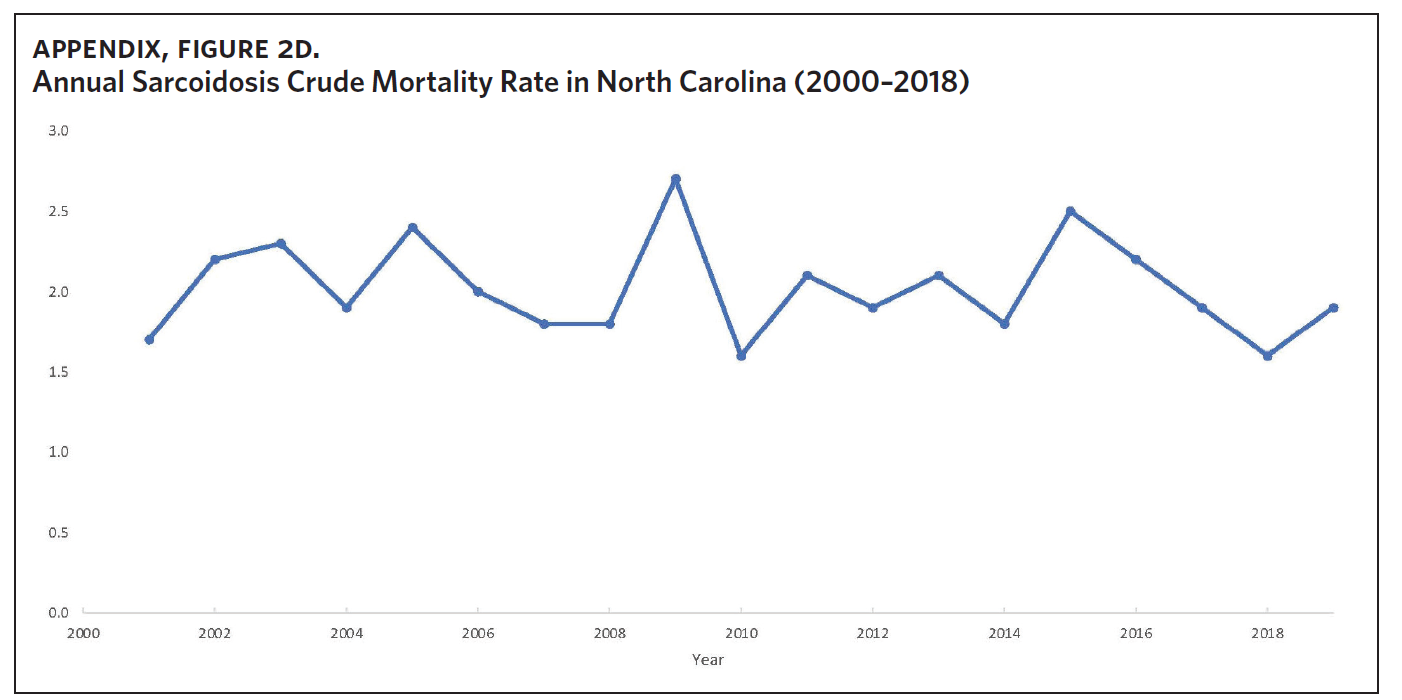
Appendix Figure 2A shows the aggregated crude mortality rates from 2000 to 2018. The highest crude mortality rate was in ENC (1.16/100,000), followed by the Piedmont region (0.49/100,000), and the lowest crude mortality rate was in Western North Carolina (0.32/100,000). The crude mortality rate in ENC was higher than the state and the national average. Appendix Figure 2B shows the age-adjusted sarcoidosis mortality rates from 2000 to 2018. The age-adjusted mortality pattern was similar to the crude mortality rates, with ENC recording the highest rate at 1.07 per 100,000 deaths (Appendix Figure 2B). Appendix Figure 2C shows the overall sarcoidosis mortality trend in North Carolina from 2000 through 2018. Overall, the number of deaths doubled from 22 deaths in 2000 to 53 deaths in 2018. However, the crude mortality rate (Appendix Figure 2D) was variable with the lowest rates (approximately 1.7/100,000) observed in 2000, 2010, and 2018, and the highest rates recorded in 2009 (2.7/100,000) and 2015 (2.5/100,000) (Appendix Figure 2D). When stratified by race, AA experienced the most deaths and the highest increase in number of deaths across the period (Figure 1). The number of deaths among AA increased from 18 in 2000 to 37 in 2018. An increasing trend was also noted for Whites (Figure 1). AA also had the highest crude mortality rates (Appendix Figure 2E). Crude mortality rates in AA were 1.9/100,000 versus 0.32/100,000 in Whites. (Appendix Figure 2E).

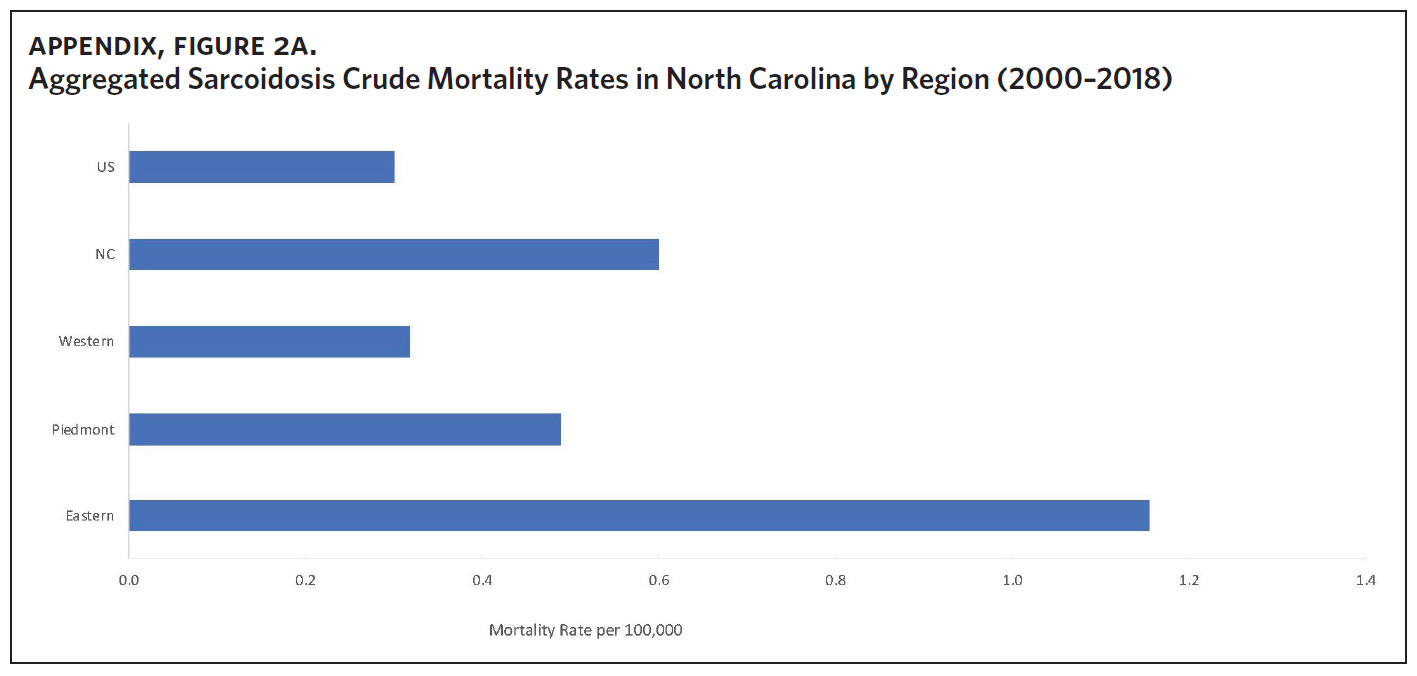
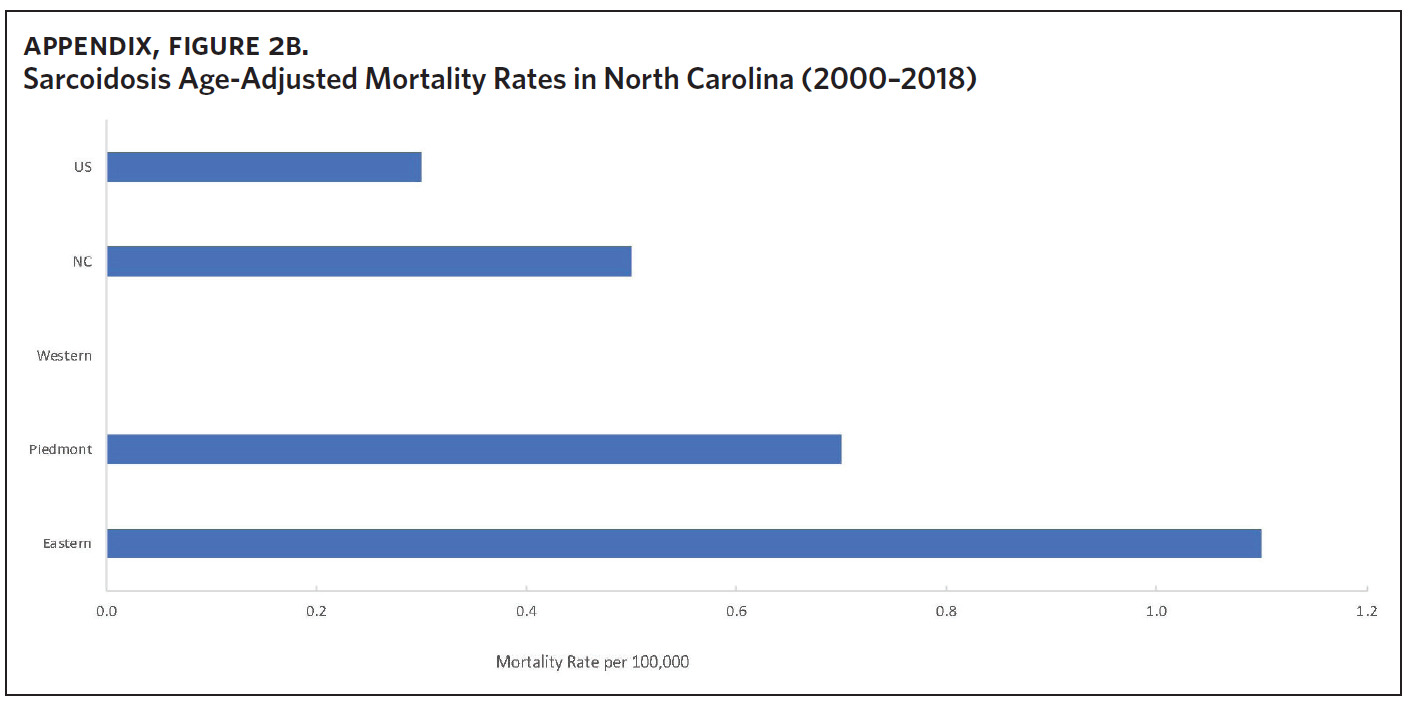
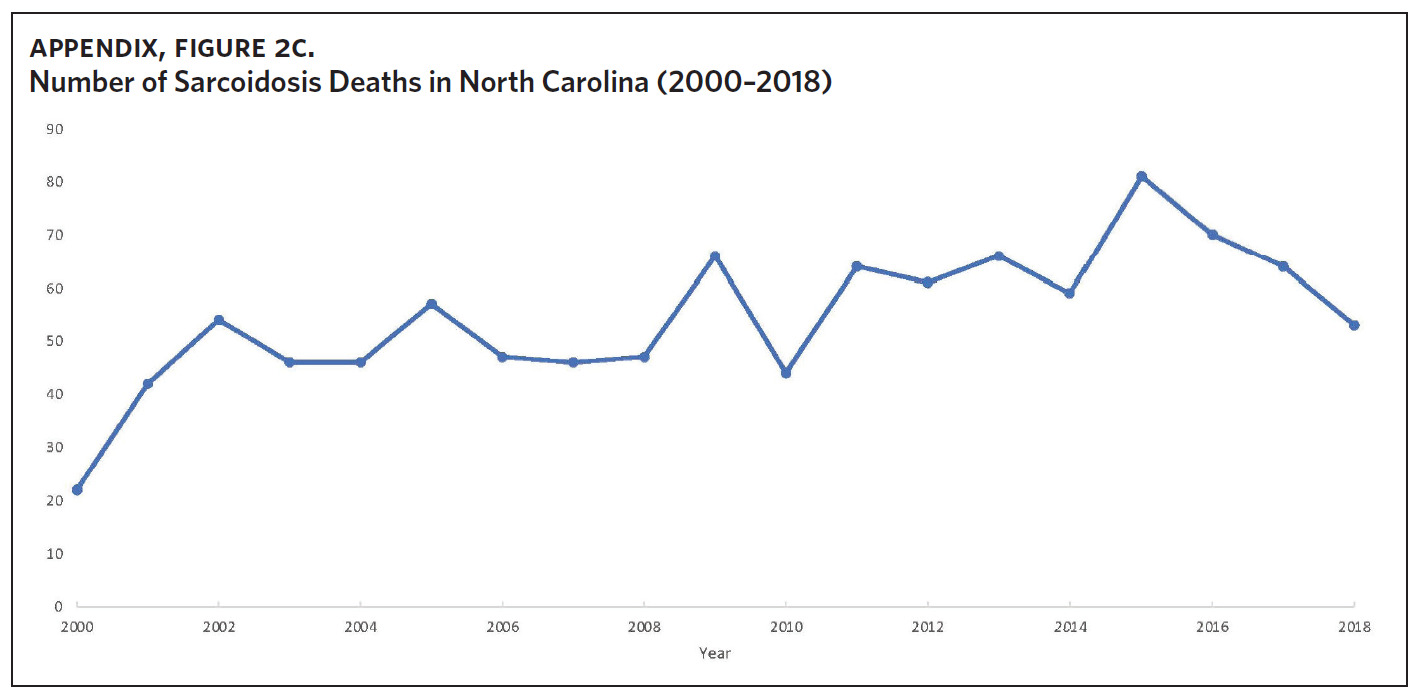
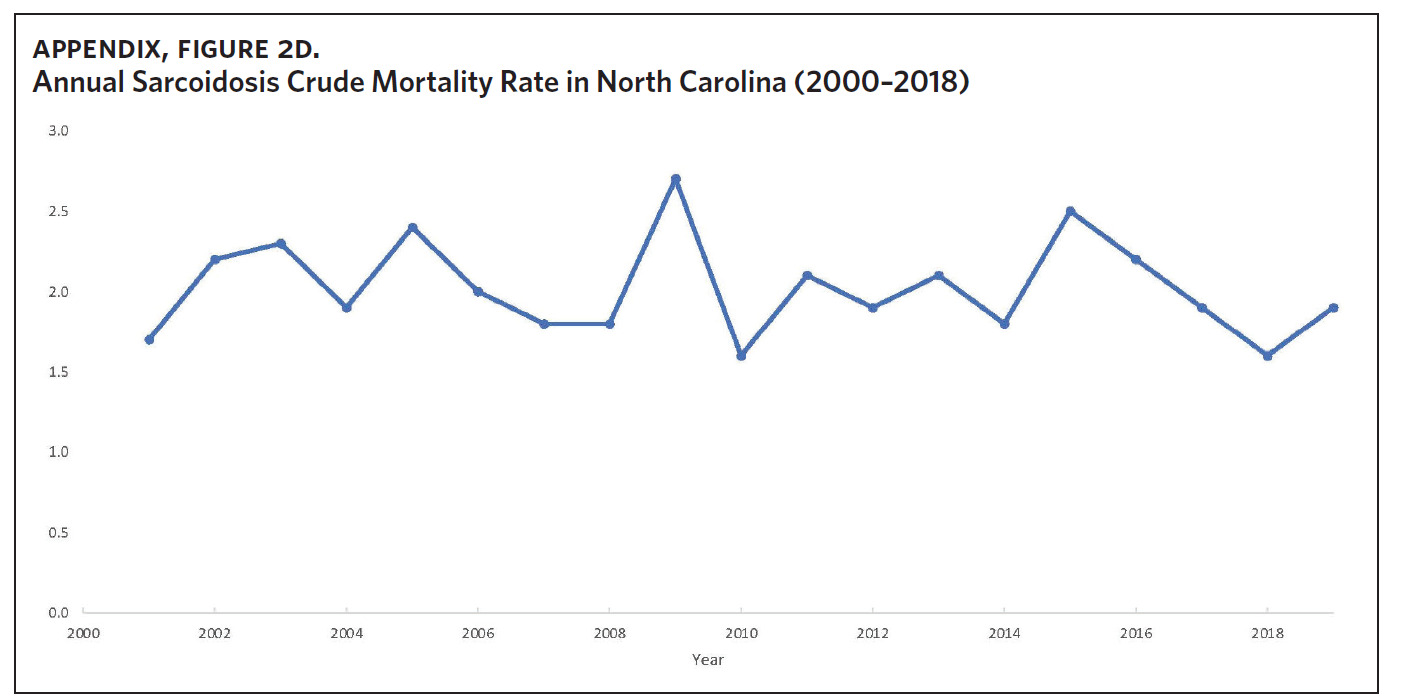
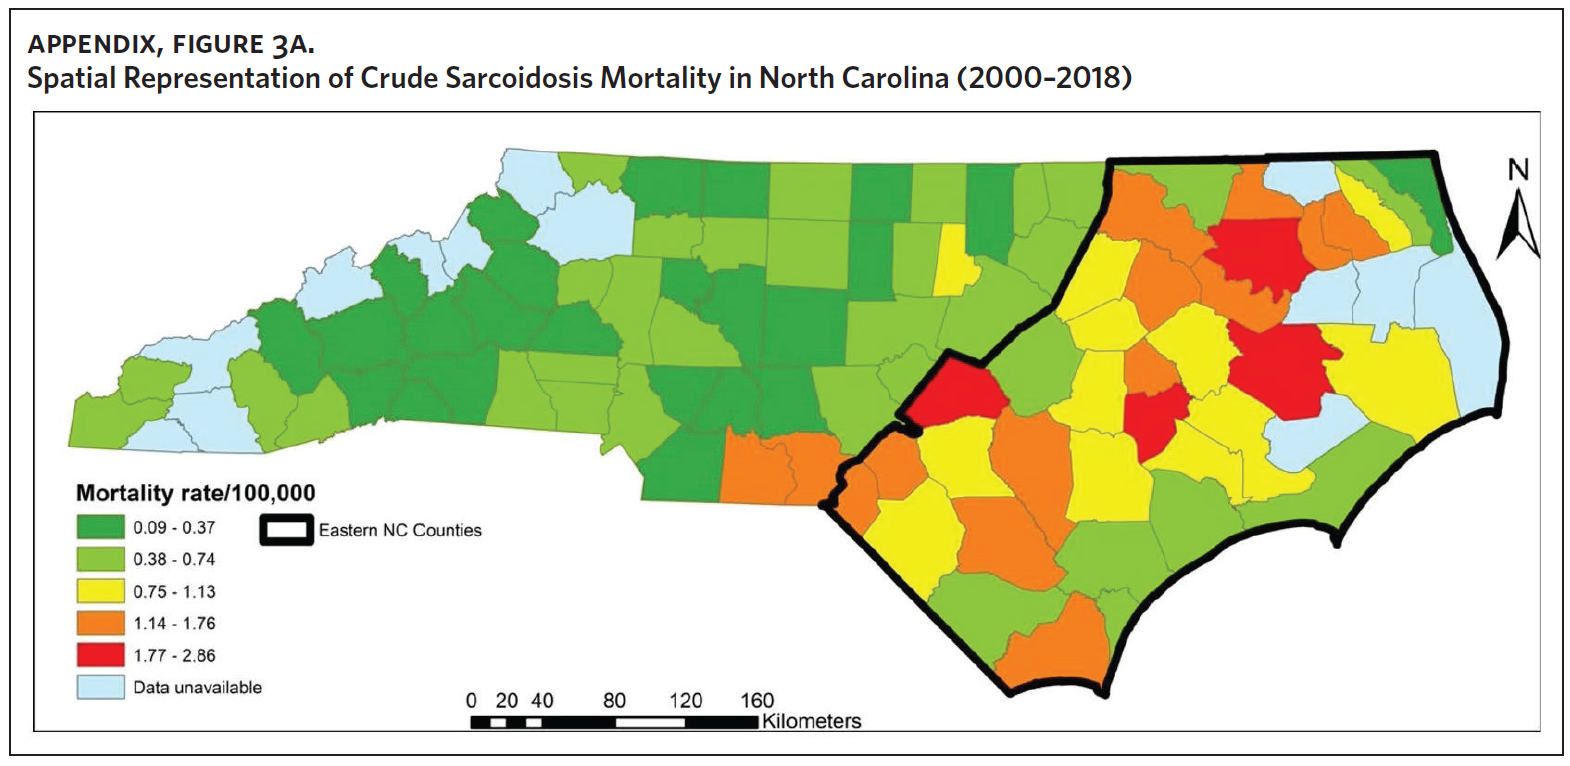
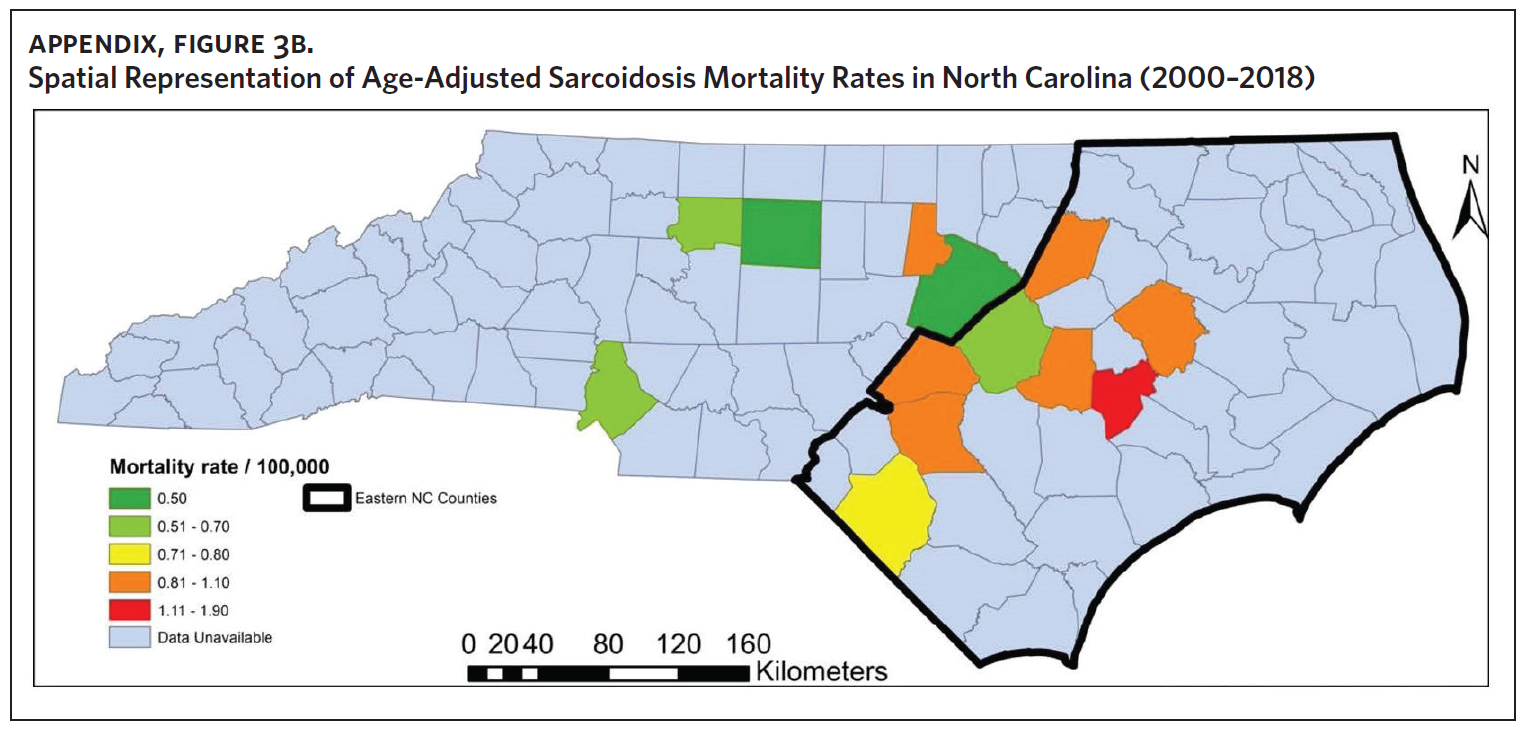
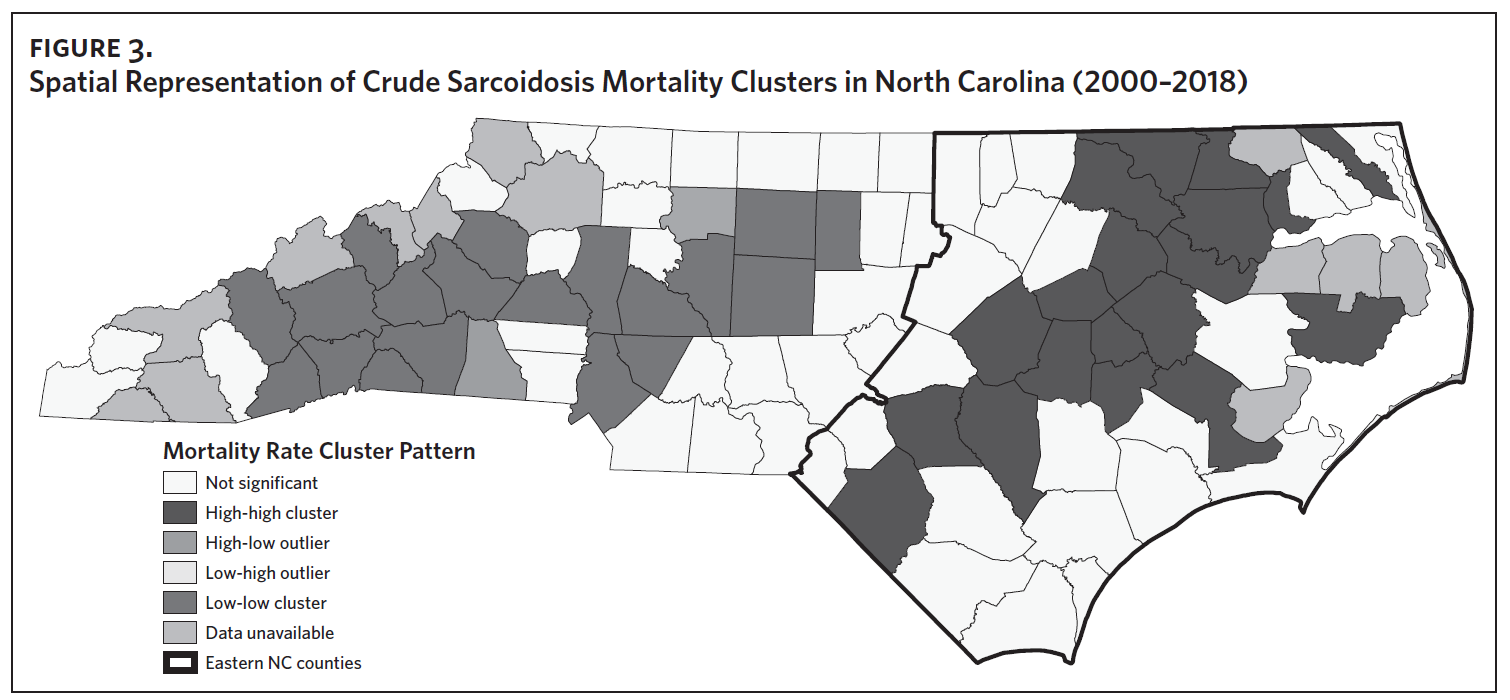
Figure 2 shows the annual sarcoidosis crude mortality rates in the United States and in North Carolina (by geographic region) from 2000 to 2018. Crude mortality was highest in ENC; this was higher than the average crude mortality in the state and nation. Mortality in the Piedmont region was lower than the state average but higher than the national average, while mortality in the Western region was lower than the state and national average. In Appendix Figure 3A, we note that several counties in the Eastern region recorded the highest crude mortality rates (2.03–2.86/100,000) while counties in the Western region recorded the lowest crude mortality rates (0–0.3/100,000). Although most of the age-adjusted mortality data in CDC WONDER was suppressed (due to low numbers), Appendix Figure 3B indicates that some of the highest age-adjusted sarcoidosis mortality rates were recorded in the Eastern region. Spatial autocorrelation analysis with a Global Moran’s I showed a statistically significant clustering pattern of sarcoidosis mortality in North Carolina (P < .001). A closer examination of the clustering pattern using Local Moran’s I indicated that there were clusters of high sarcoidosis mortality rates (high-high clusters) in the Eastern part of the state and clusters of low sarcoidosis mortality rates (low-low clusters) in the Western part of the state (Figure 3).
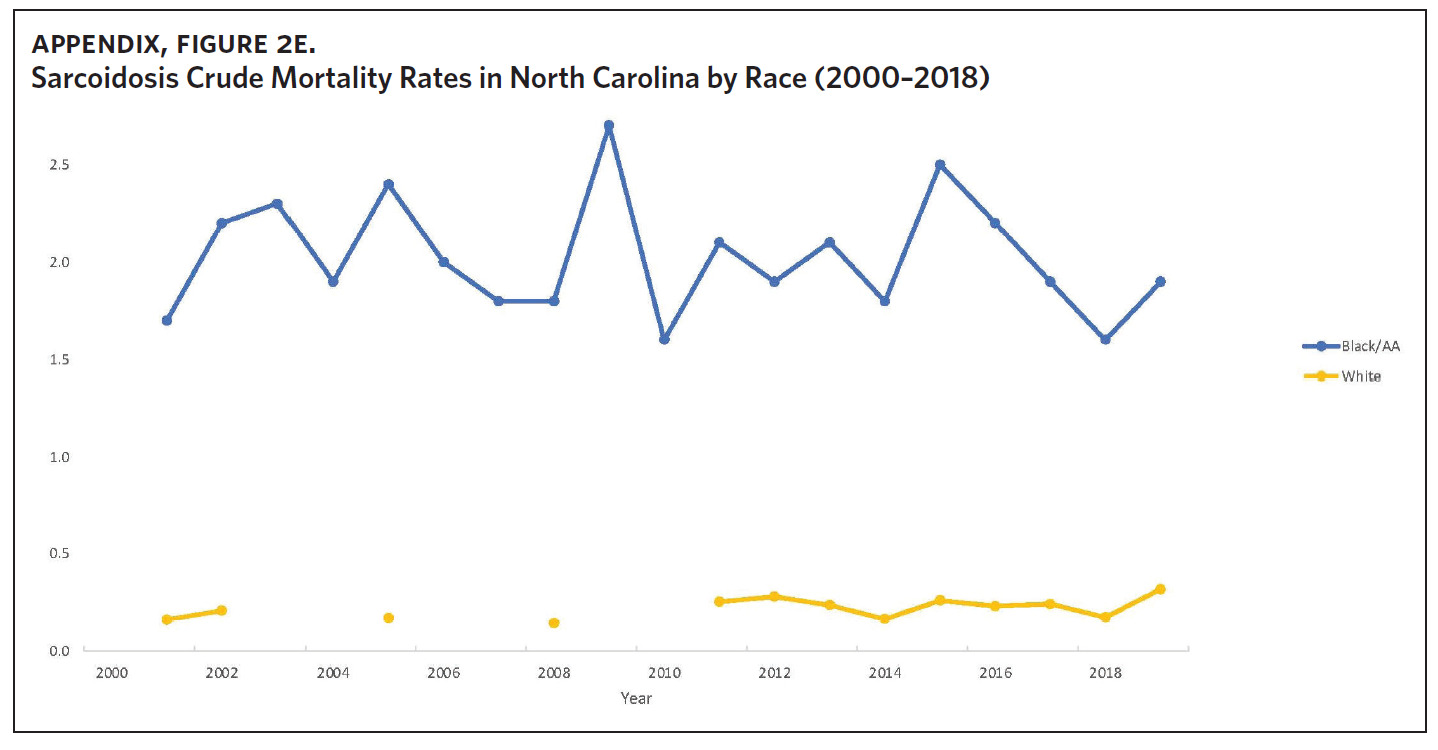
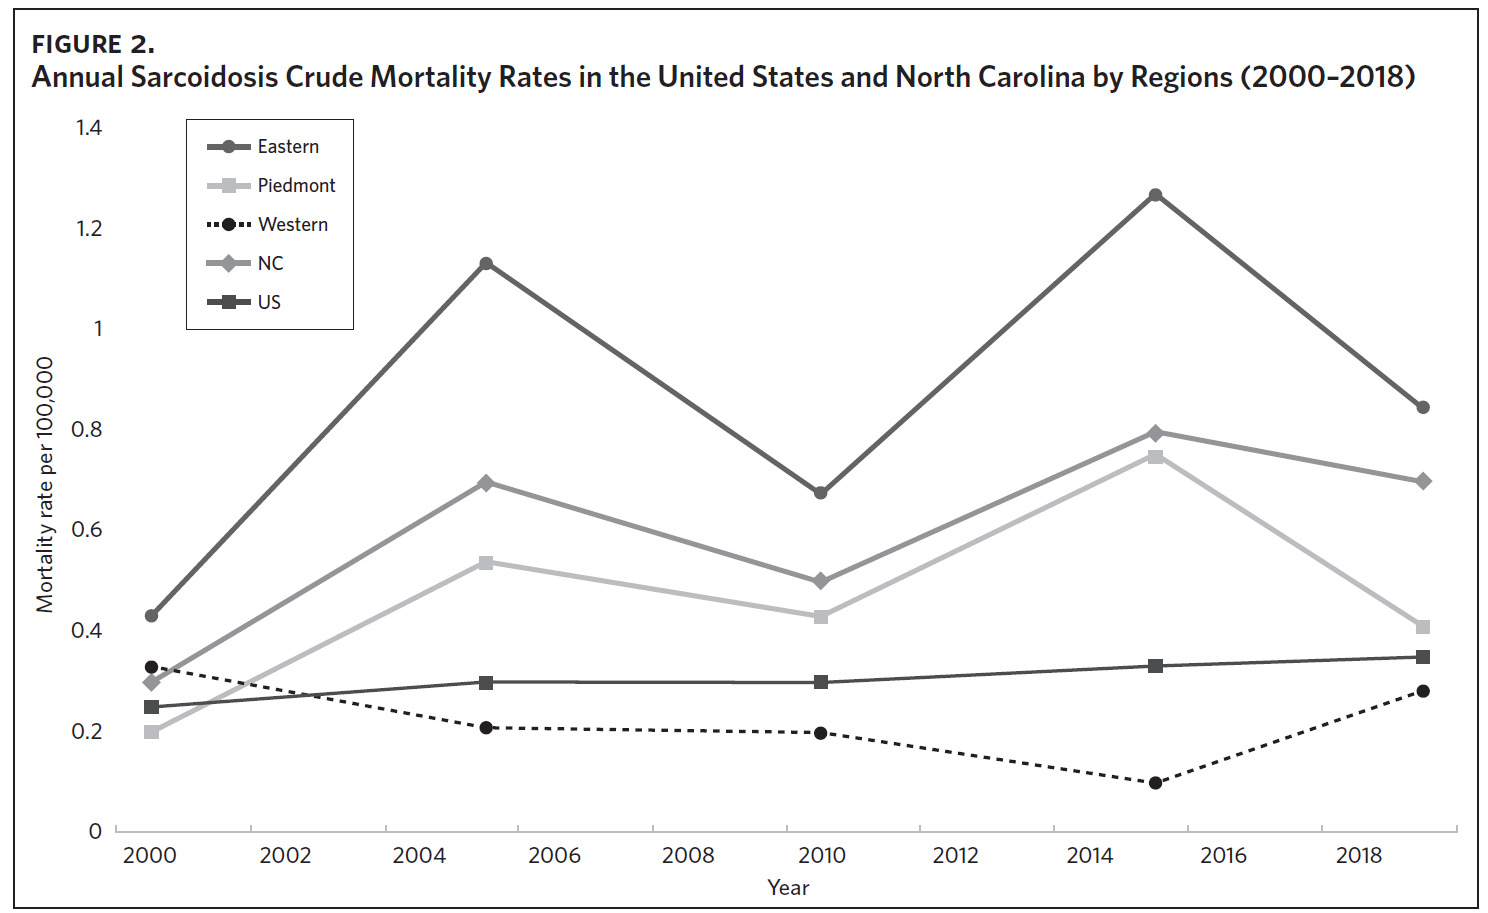

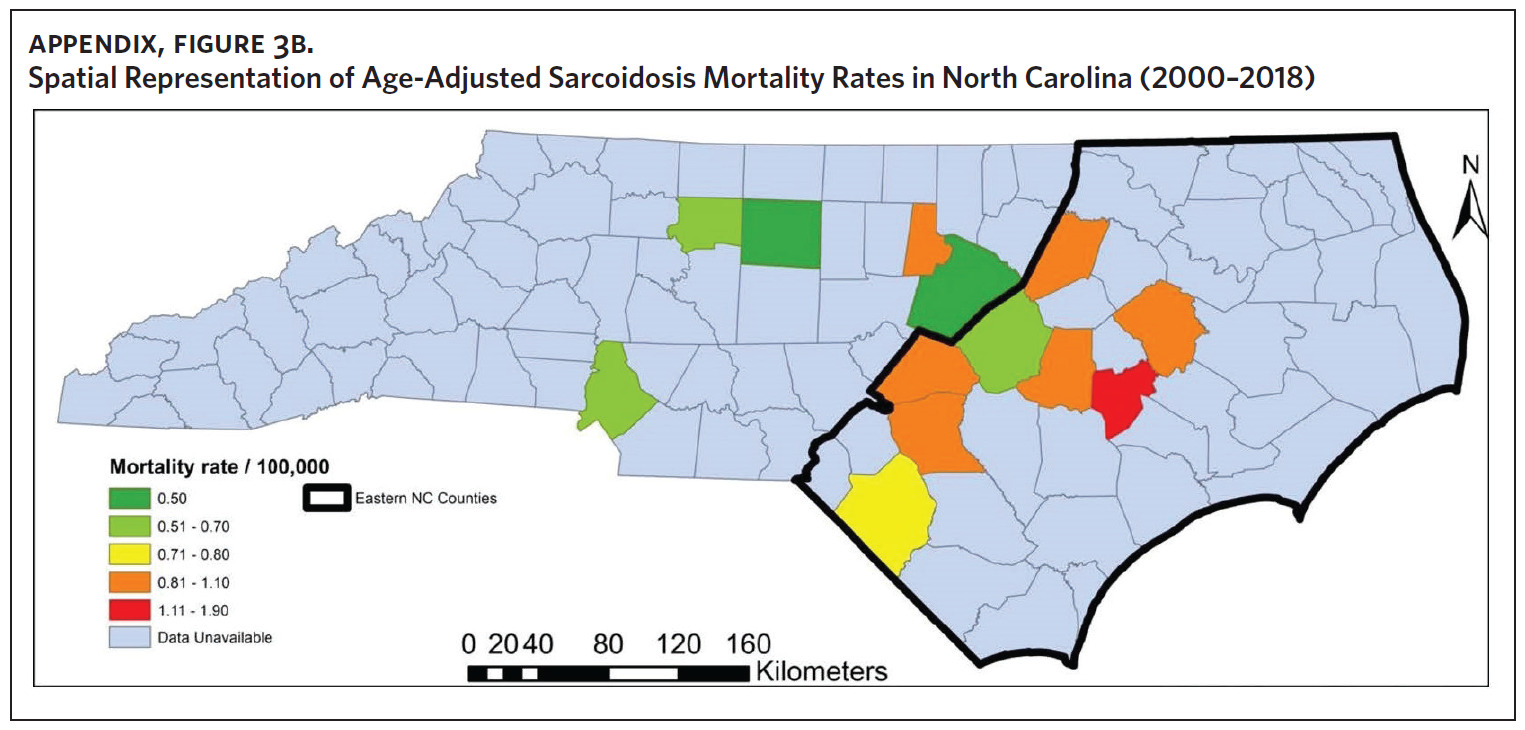
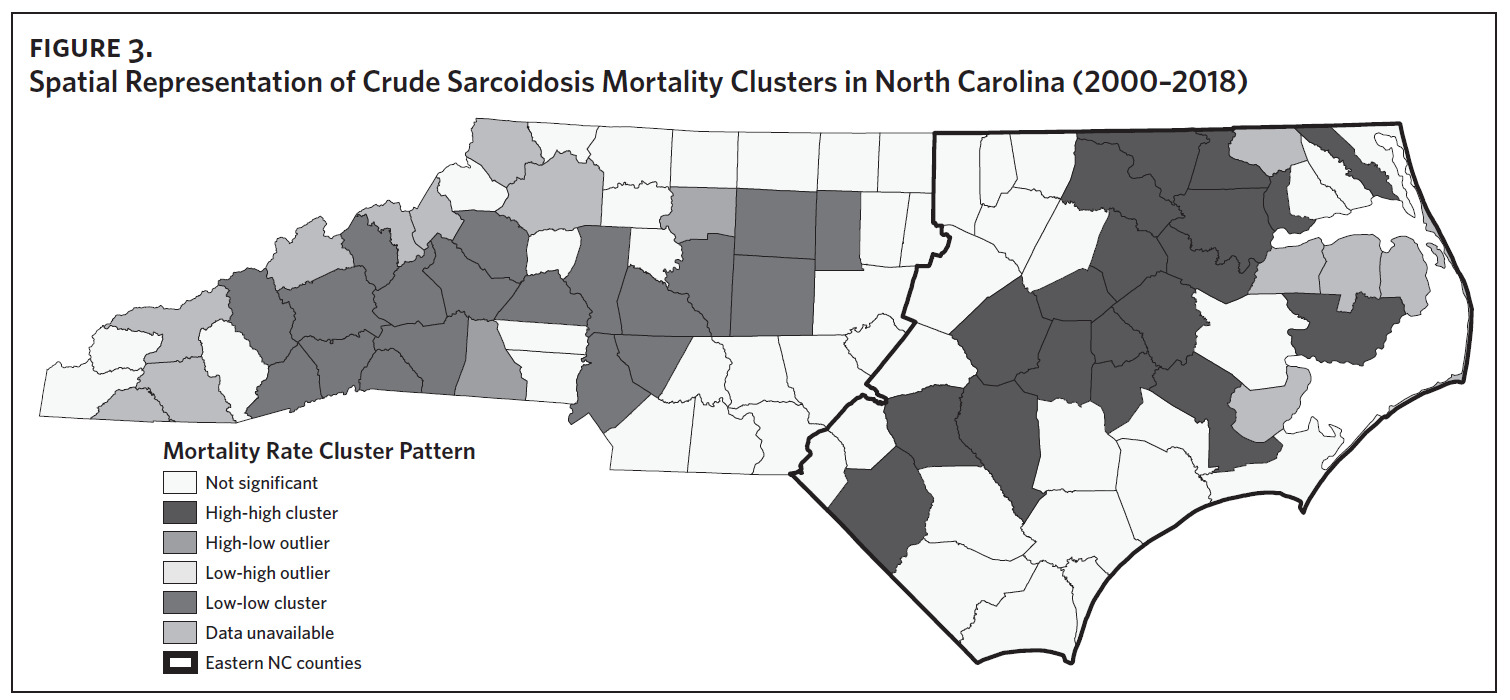
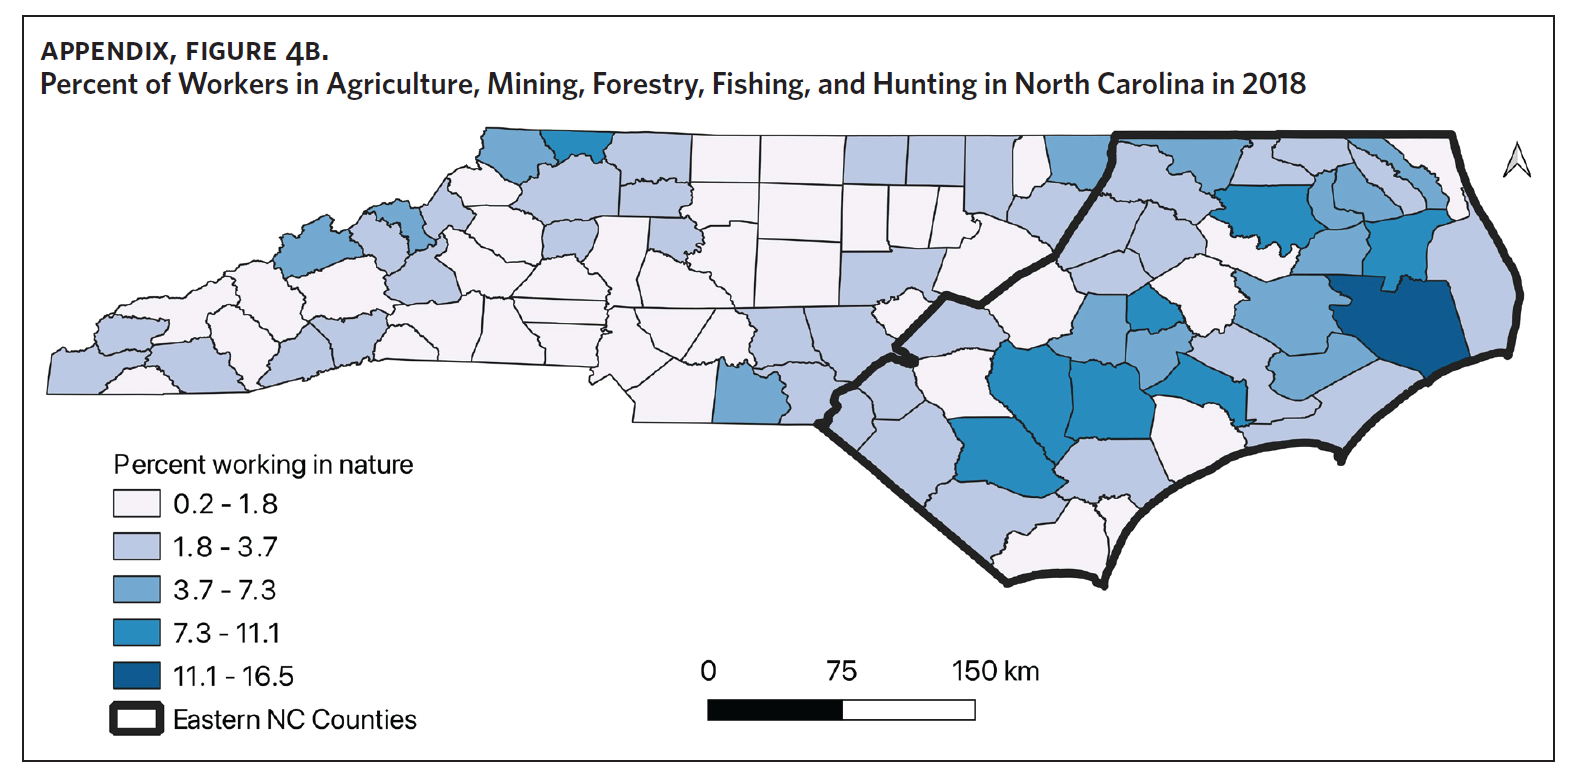
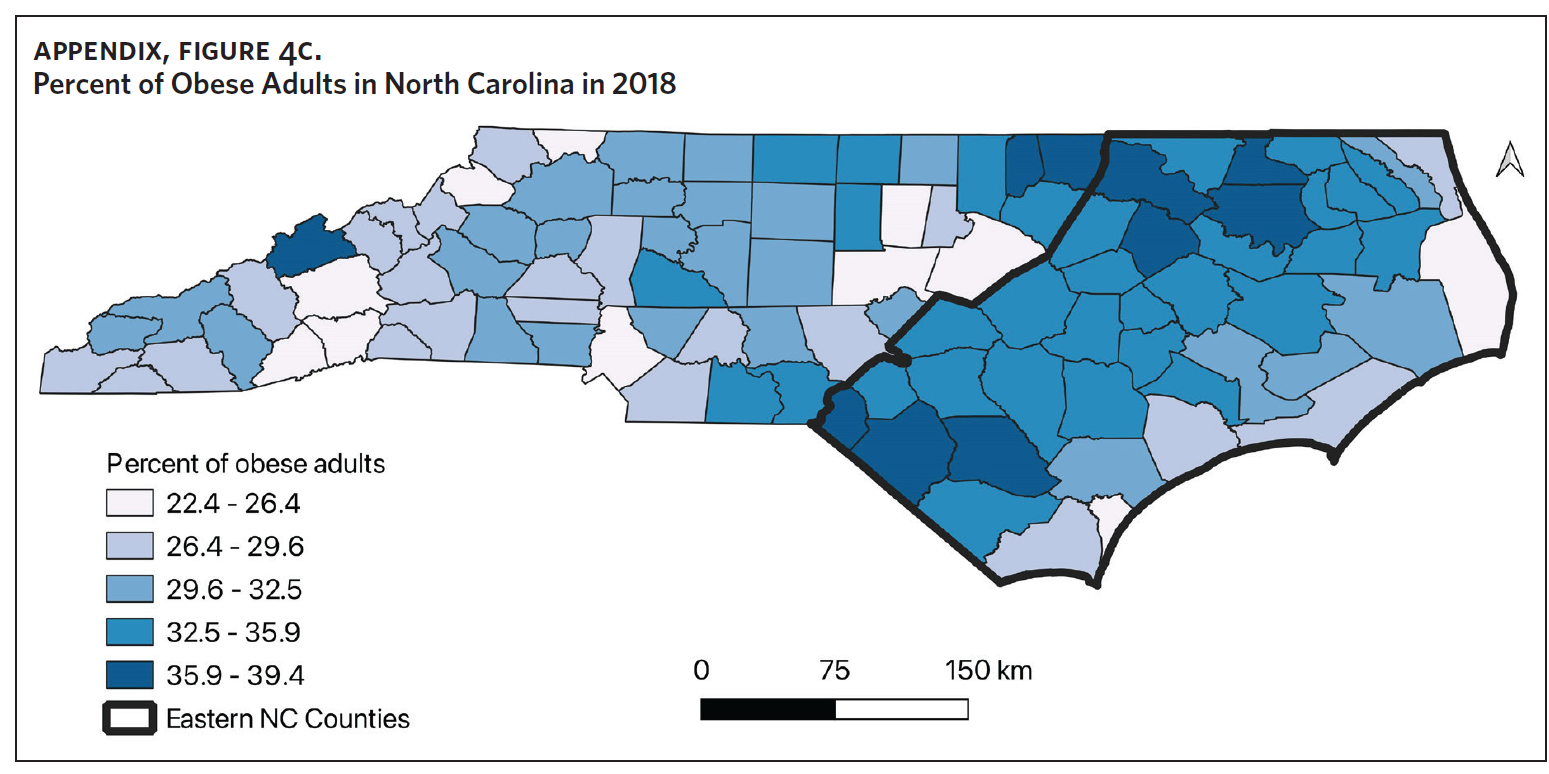
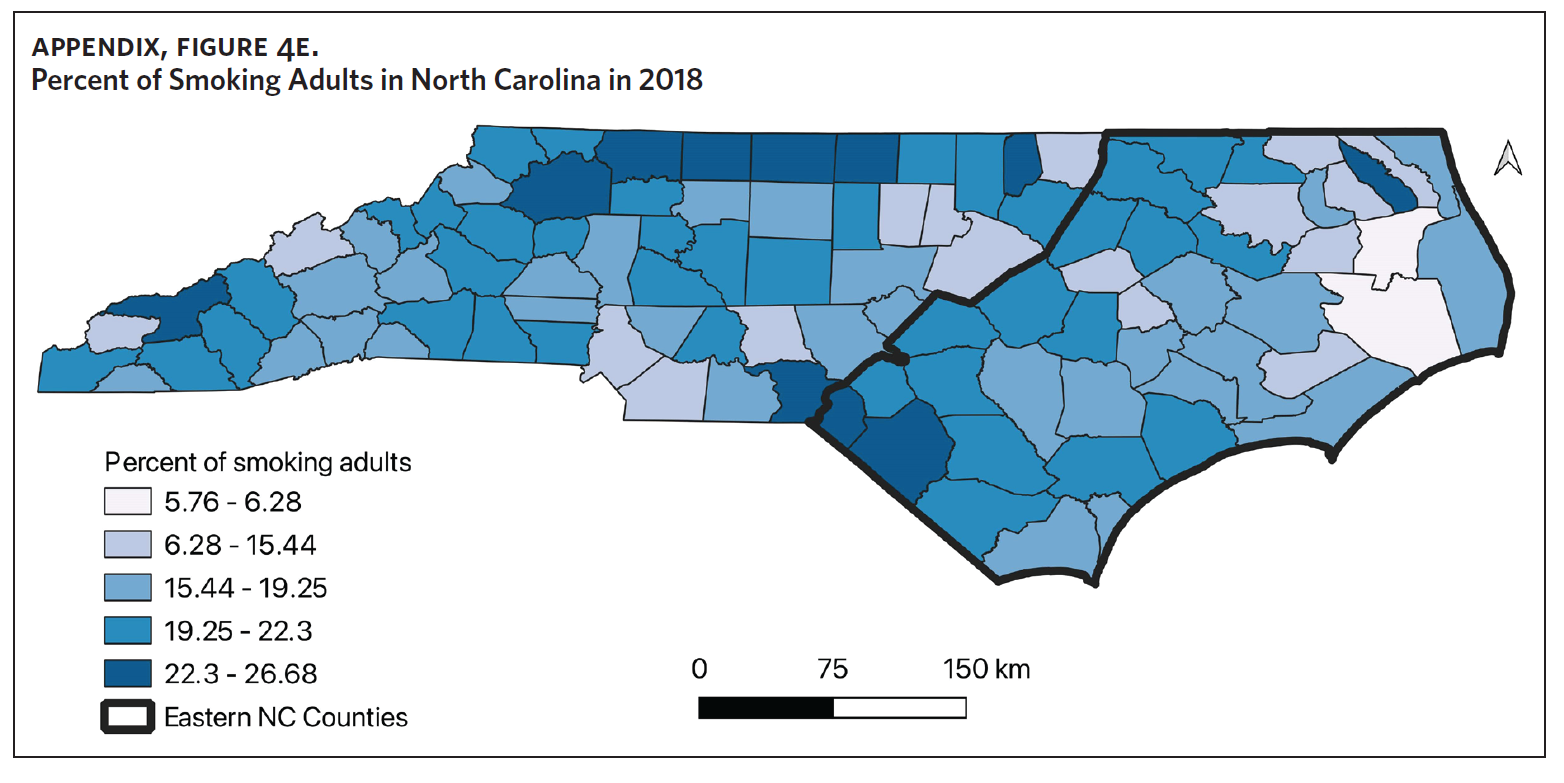
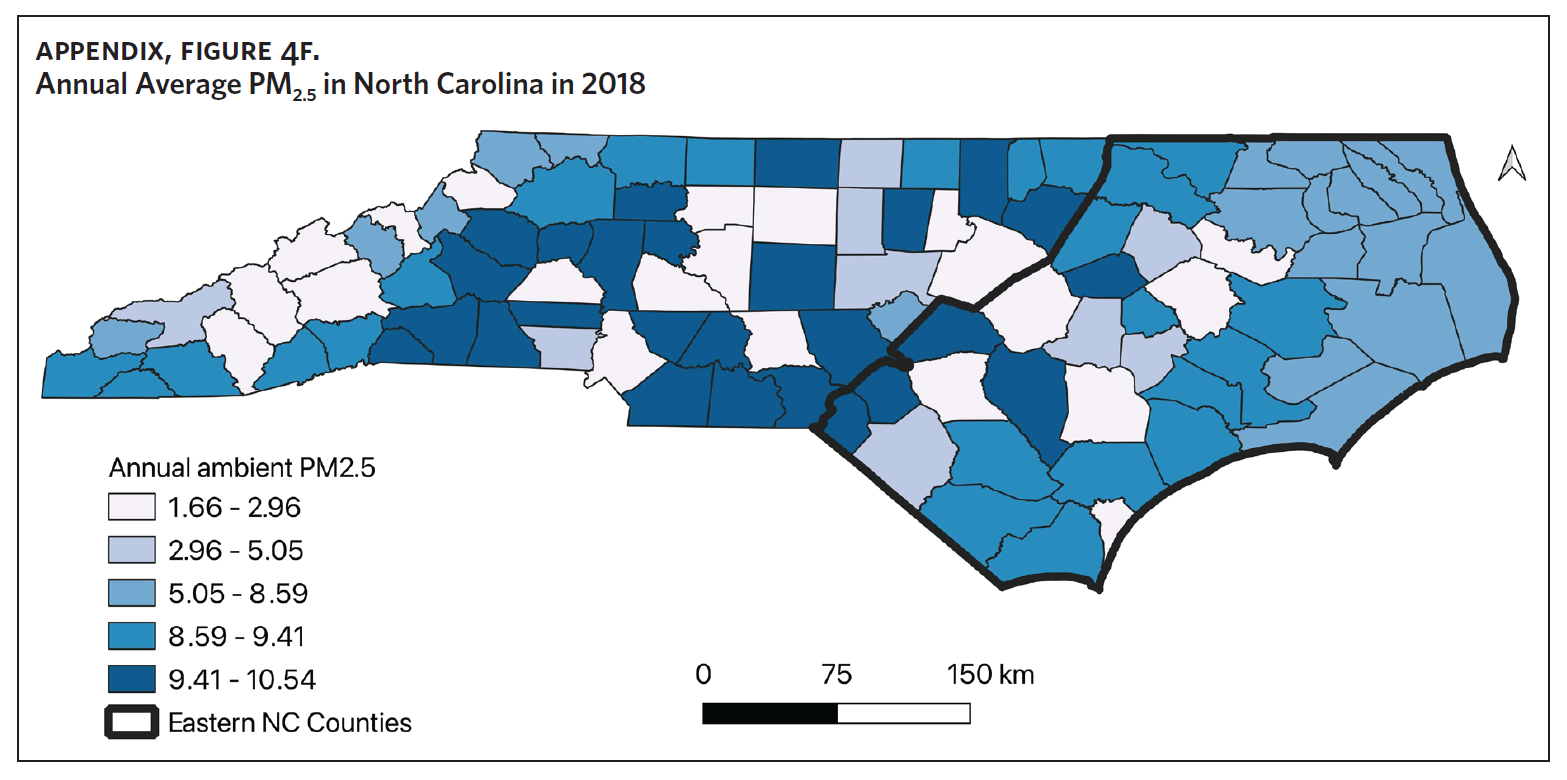
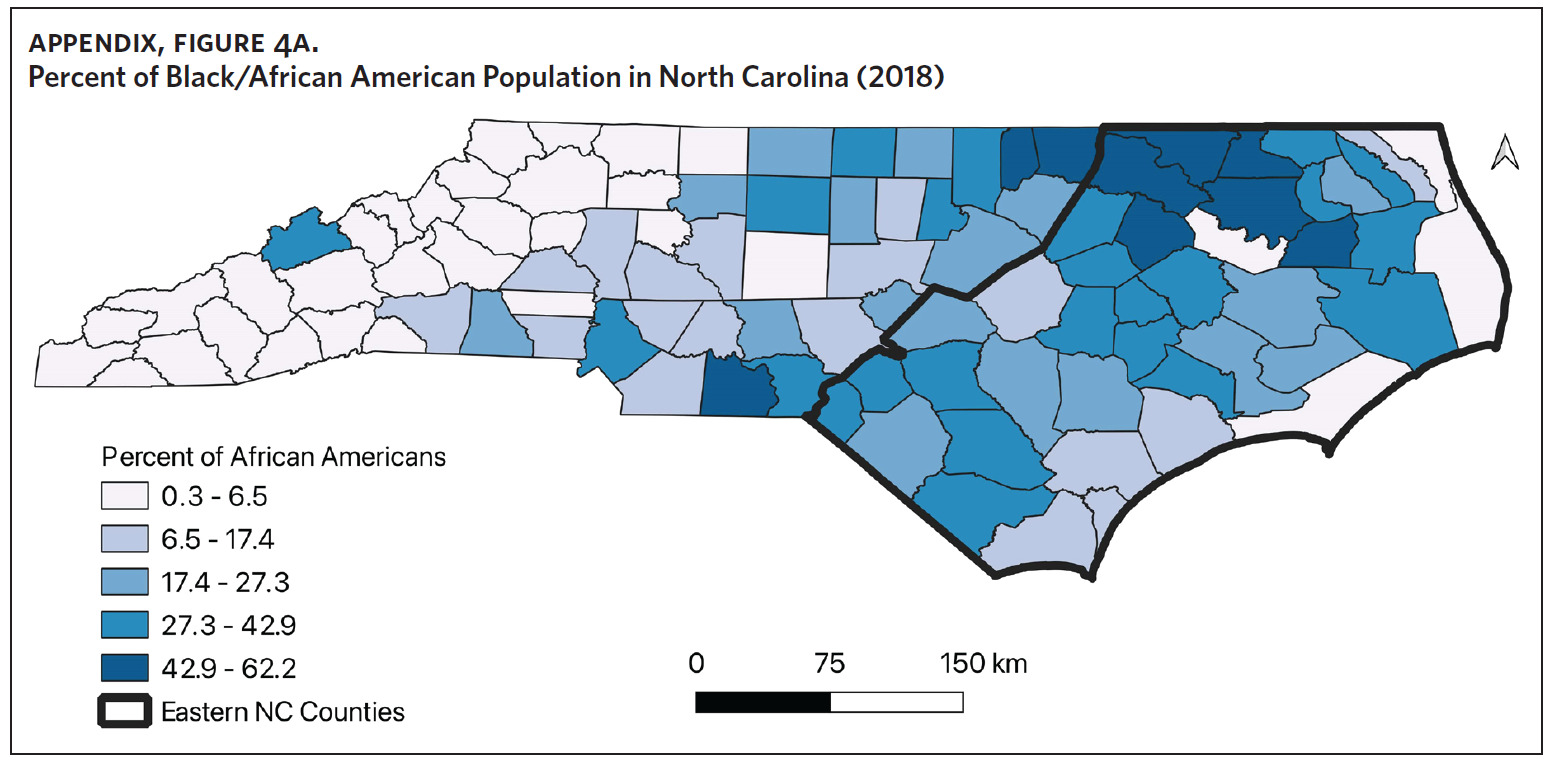
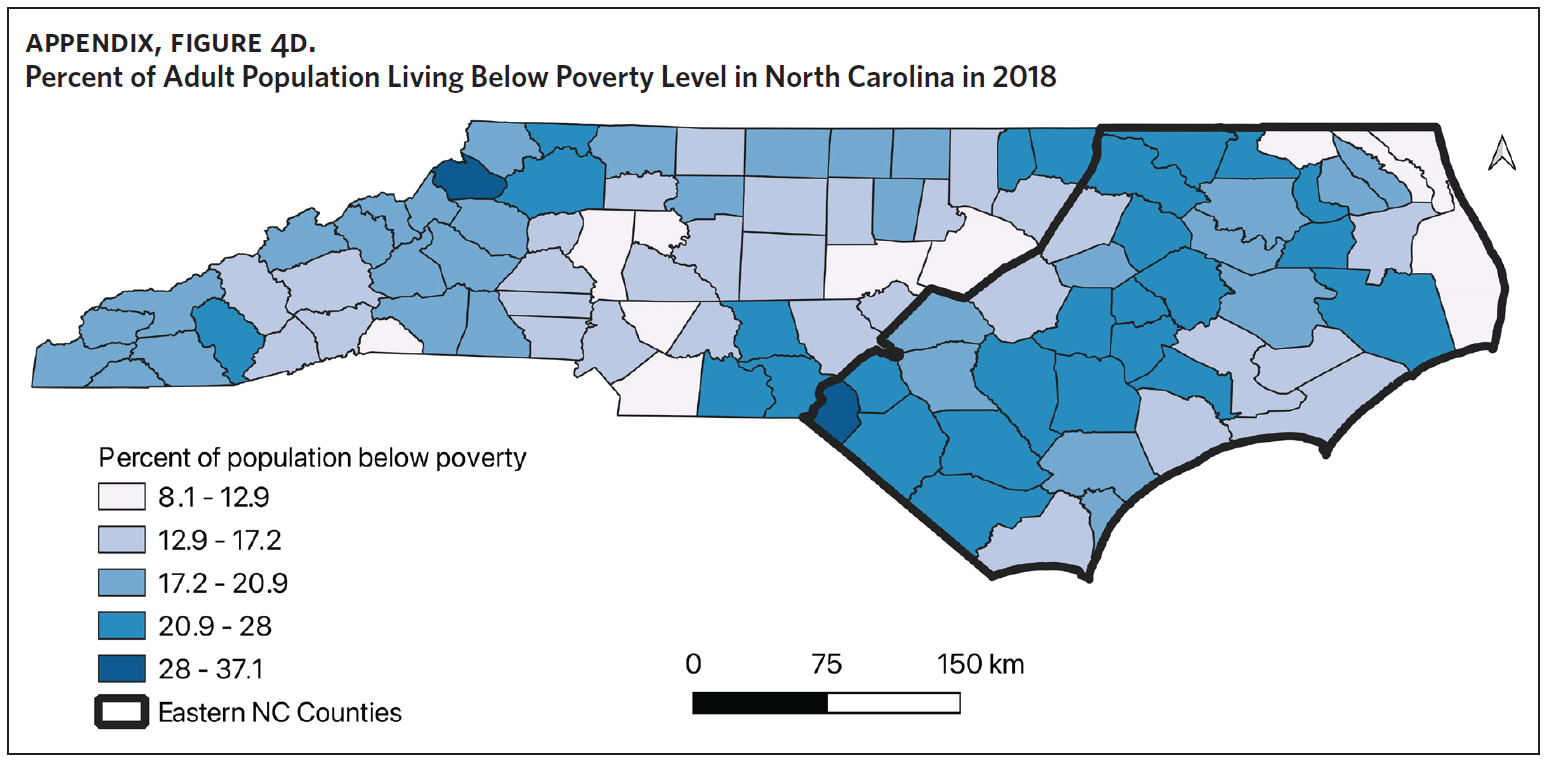
Table 1 is a summary of explored sociodemographic variables by region and Figure 4 shows the spatial distribution of these variables. There was a statistically significant difference in the percent of AA, percent of people working in nature, percent of obese adults, and percent of people below poverty level by region (Table 1). There was no difference in the percent of smoking adults or levels of PM2.5 by region (Table 1).
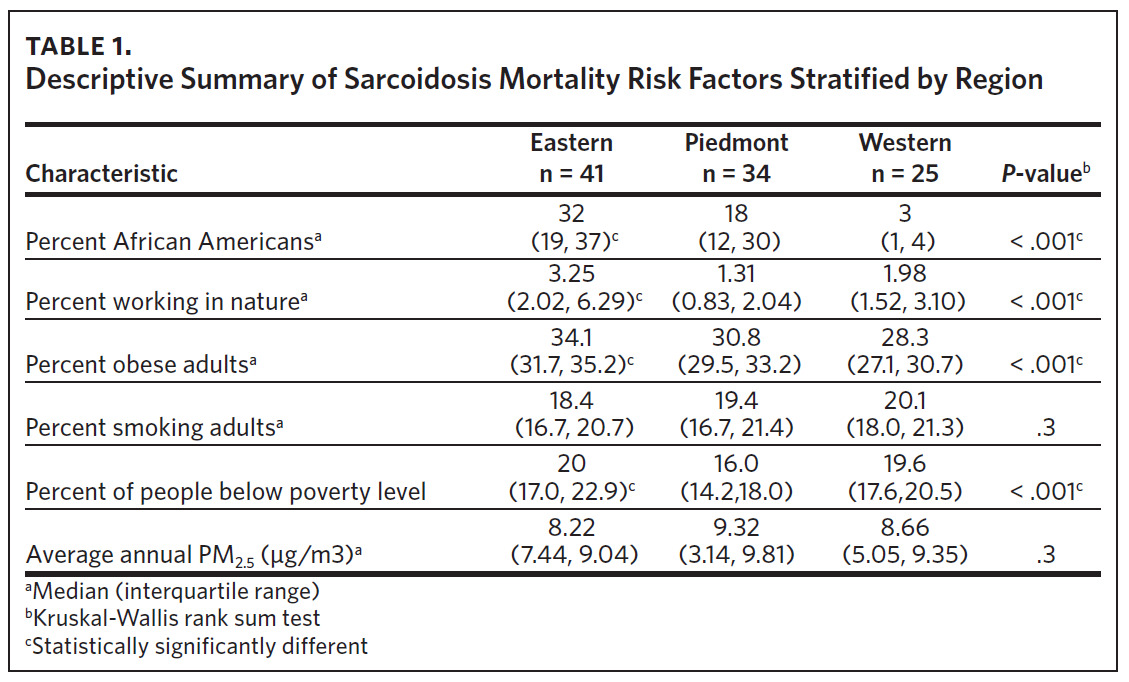
Counties in ENC had the highest percent of AA (Appendix Figure 4A), percent of people working in nature (Appendix Figure 4B), percent of obese adults (Appendix Figure 4C), and percent of population below poverty level (Appendix Figure 4D); while counties in Western NC had lowest percent of AA and percent of obese adults; and counties in the Piedmont area had the lowest percent of people working in nature and percent of population living below poverty level (Appendix Figures 4A–D). Bertie, Herford, Halifax, and Edgecombe counties in ENC had the highest percent of AA, percent of obese adults, percent of people working in nature, and percent of people living below poverty level, and were also among the counties with the highest crude mortality rates (Appendix Figure 3A and Appendix Figures 4A–D). Conversely, counties along the coast of ENC (such as Currituck, Camden, Carteret, Onslow, and New Hanover), a region referred to as Tidewater, had low sarcoidosis crude mortality rates compared to the rest of ENC (Inner Coastal Plain). These counties also had a lower prevalence of poverty and obesity compared to other counties in ENC. The Western region had counties with the highest percent of smokers (Appendix Figure 4E), while the Piedmont had counties with the highest annual ambient PM2.5 (Appendix Figure 4F). However, these differences were not statistically significant (Table 1).


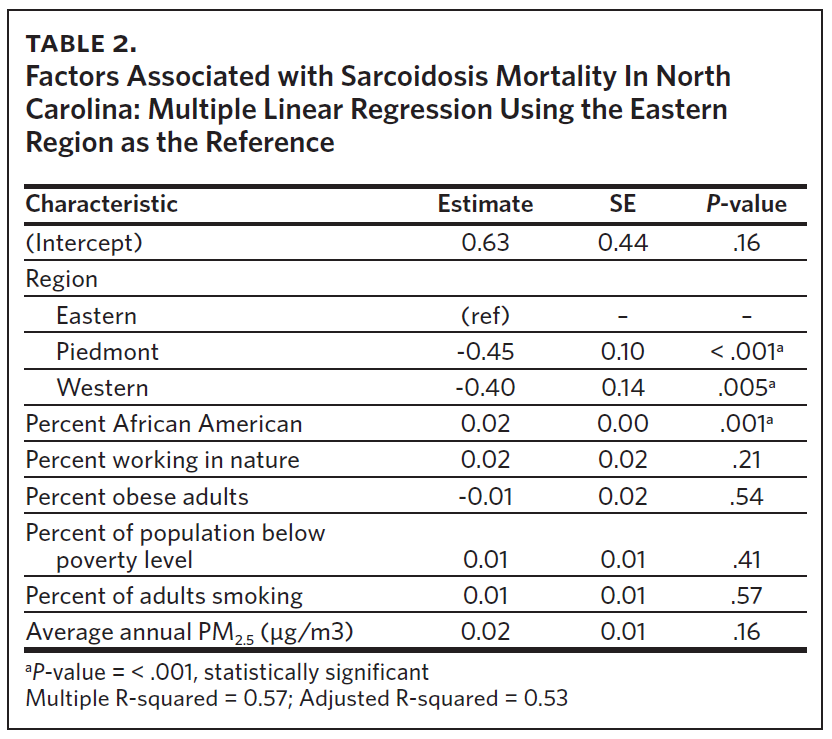
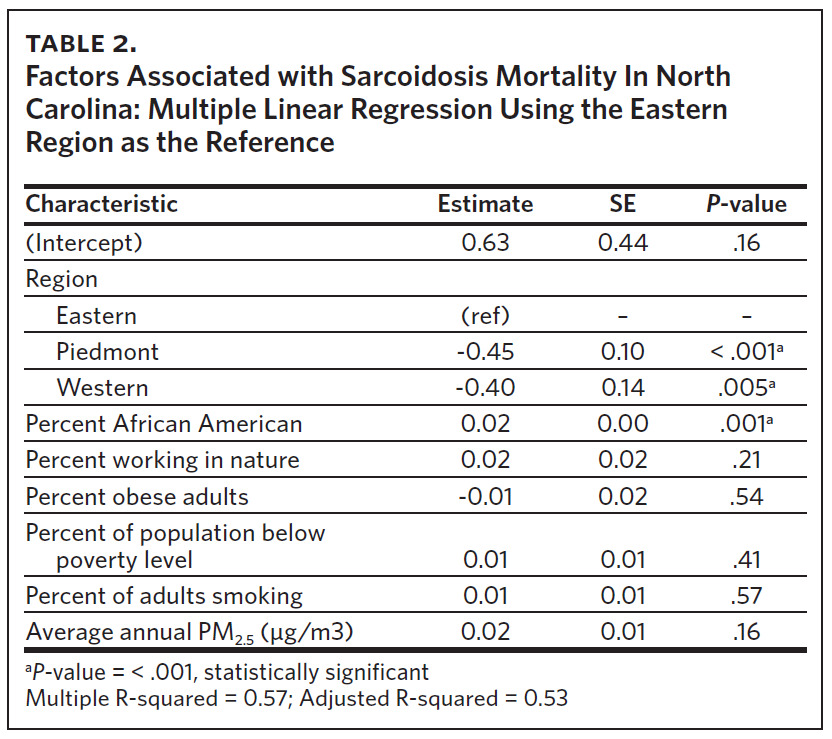
Multivariable linear regression analysis including all the variables showed that region and percent of AA were statistically significant factors influencing sarcoidosis mortality rates in North Carolina (Table 2). Compared to ENC (as a reference region), sarcoidosis mortality rates were 45% lower in the Piedmont region and 40% lower in the Western region. Percent of population working in nature, percent of obese adults, percent of population below poverty level, percent of adults smoking, and annual average ambient PM2.5 were not statistically significant mortality predictors in the multi-variable regression model. Overall, the sociodemographic risk factors evaluated accounted for 53% of observed variability in sarcoidosis mortality in North Carolina, as indicated by the model’s adjusted R-squared value of 0.53.
Discussion
Our study found that sarcoidosis-related mortality in North Carolina varied by region. ENC had the highest number of sarcoidosis-related deaths, the highest crude and age-adjusted sarcoidosis-related mortality rates, and statistically significant high-high sarcoidosis mortality clusters. ENC also had the highest percent of AA, percent of people working in nature, percent of obese adults, and percent of people living below poverty level. Counties with the highest levels of these sociodemographic variables also had the highest crude mortality rates. In addition to variability by region, multivariable analysis revealed that the percentage of AA living in the region was also an independent predictor of sarcoidosis mortality in North Carolina. Compared to ENC, sarcoidosis mortality rates were 45% lower in the Piedmont region and 40% lower in the Western region. There was no association between sarcoidosis-related mortality and percent of adult smokers or average annual PM2.5 levels across North Carolina.
This is the first study to evaluate regional variability of sarcoidosis mortality in North Carolina. Other studies have evaluated regional variability of sarcoidosis mortality in the United States, with the highest mortality rates noted in the South and Southeast.8,9,11,12 Baughman and colleagues observed the highest incidence and prevalence of disease in the southern United States,13 and it is plausible that the areas with the highest incidence/prevalence of disease also have the highest mortality. To the best of our knowledge, there are no studies that have evaluated the regional variability of sarcoidosis incidence and prevalence in North Carolina, therefore we are unable to correlate our mortality data to disease incidence or prevalence. On a separate note, Lee and colleagues found that state-level disparities in health were associated with sarcoidosis-related mortality in the United States.10 In their study, states with better health rankings had lower mortality rates, suggesting that sarcoidosis-related mortality could be an indicator of state-level disparities in health care.10 ENC, which had the highest mortality rates, also had the highest percent of obese adults and people living below poverty level, suggesting perhaps that the increased sarcoidosis mortality in ENC could be an indicator of the health and socioeconomic disparities in North Carolina. This is important, as we observed that the poorest counties in ENC also had the highest mortality rates. Previous work by Mansfield and colleagues identified increased all-cause mortality in ENC and linked this to the socioeconomic and sociodemographic health care disparities in the state.30 Other studies have found that poverty resulting in reduced access to care disproportionately affects people by race, geolocation, and income groups, and contributes significantly to increased morbidity and mortality in chronic diseases, including sarcoidosis.7,22,30–34 We believe that these factors and others that bear further study are contributory to the increased sarcoidosis mortality observed in ENC.
In addition to regional variability in sarcoidosis mortality, our study also found that race was an independent mortality predictor in North Carolina. This was expected and is consistent with findings from other studies.7–9 Counties with the highest percentage of AA had the highest sarcoidosis-related mortality. While these counties are in ENC, it is important to note that both region and percentage of AA were independent mortality predictors in the multivariate model. The reasons for increased sarcoidosis mortality in AA are multifactorial and are not always biologic.35 Sarcoidosis occurs more commonly in AA,13,36,37 and several studies have shown that AA have more severe forms of disease, including more organ involvement and a higher prevalence of high-risk disease manifestations that are associated with increased mortality.38–40 Additionally, AA with sarcoidosis have higher comorbidity burdens and hospitalization rates than other racial groups41; several studies suggest that there is an intersection between race and various socioeconomic factors that disproportionally affects access to care and disease outcomes for AA with sarcoidosis.22,23,42 Rabin and colleagues found that sarcoidosis patients in the lowest income groups were more likely to have more severe disease at presentation, report significant barriers to care, and have overall poorer general health and physical functioning.22 They were also more likely to be African American.22 We suspect that these reasons also explain the higher mortality found in counties with the highest percent of AA in North Carolina. However, additional studies are warranted to further evaluate this association.
Several environmental and occupational exposures have been associated with an increased risk of developing sarcoidosis.3,19,20 Specifically, environmental exposures such as mineral and farm dust, pesticides, and animal waste have been associated with an increased incidence of disease.20,43 Our study showed that ENC, with its highest sarcoidosis-related mortality, also had the highest percentage of people working in nature. This includes occupations in agriculture, animal farming, mining, fishing, hunting, and forestry. Although these occupations and their expected environmental exposures have been linked to increased incidence of disease, their role in the disproportionately higher sarcoidosis-related mortality in ENC is unknown. We speculate that they may be associated with higher disease incidence; however, no studies have evaluated sarcoidosis incidence and these related factors in North Carolina.
We did not find any association between mortality and air quality as measured by ambient levels of PM2.5. PM2.5 levels were highest in the Piedmont region. However, it is important to note that no county had an average ambient PM2.5 level that was greater than the US Environmental Protection Agency (EPA) recommended annual average level of 12 micrograms per cubic meter.44
There was also no association between smoking and mortality in our study. This is similar to findings from another study evaluating inpatient sarcoidosis mortality utilizing data from the National Inpatient Sample.25
Our study has several limitations. First, mortality data in CDC WONDER are derived from death certificates, and these are not always accurate. It is possible that sarcoidosis mortality may be under- or over-represented depending on the accuracy to which these certificates were completed. Secondly, due to the small number of sarcoidosis deaths observed in some counties, age-adjusted sarcoidosis mortality rates were suppressed. This limited our ability to explore age-adjusted sarcoidosis mortality clusters in the state and compelled us to use crude mortality rates to demonstrate clustering. Thirdly, no studies have evaluated the incidence or prevalence of sarcoidosis by county in North Carolina. Therefore, we are not able to properly contextualize our observed mortality in relation to disease incidence. Finally, our study is a cross-sectional analysis with exposure limited at the county level. Consequently, our findings reflect associations and do not imply causality. Importantly, risks should only be interpreted at the county level and cannot be extrapolated to an individual level. Though unique in being the first study to evaluate sarcoidosis mortality in North Carolina, our study raises several questions and should form the basis for additional studies to further evaluate the epidemiology of sarcoidosis in North Carolina.
Conclusion
This study identified significant differences in spatial distribution of sarcoidosis mortality in North Carolina. ENC has the highest sarcoidosis-related mortality in North Carolina with high-high mortality clusters. The distribution of several sociodemographic determinants of health, including race, poverty, obesity, and percent of people working in nature, were shown to be more prevalent in Eastern North Carolina. Region and percent of AA were independent predictors of increased sarcoidosis mortality in the state. Neither air quality nor percent of smokers was associated with sarcoidosis-related mortality in North Carolina.
Financial support
The study was non-funded, and the authors note that there were no relevant conflicts of interest associated with the study or manuscript preparation.
Author contributions
David Wambui: study conceptualization, data curation, formal analysis, methodology, validation, visualization, project administration, and writing. Gregory Kearney: study conceptualization, data curation, formal analysis, methodology, validation, visualization, project administration and supervision, provision of resources, and writing.
Kevin O’Brien: data analysis, methodology, validation, visualization, provision of resources, and writing. Guy Iverson: study conceptualization, data curation, methodology, validation, visualization, supervision, provision of resources, and writing. Ogugua Ndili Obi: study conceptualization, data analysis, methodology, validation, visualization, project administration and supervision, validation, and writing. Guarantees the paper.