Loading [Contrib]/a11y/accessibility-menu.js
1.
Gora Combs K, Austin AE, Shiue KY, Proescholdbell S, Cox ME, Naumann RB. Racial/Ethnic and Sex Differences in Coping Mechanisms and Barriers to Health Care Among Adults with Chronic Pain: North Carolina, 2018-2019. North Carolina Medical Journal. Published online March 7, 2025. doi:10.18043/​001c.121420
Download all (3)
  • Figure 1. Chronic Pain Coping Mechanism Use Among Individuals with and Without Health Care Access Barriers, NC BRFSS, Combined 2018 and 2019
  • Figure 2. Chronic Pain Coping Mechanism Use Among Individuals With and Without Health Care Access Barriers by Sex, NC BRFSS, Combined 2018 and 2019
  • Figure 3. Chronic Pain Coping Mechanism Use Among Individuals with and Without Health Care Access Barriers by Race/Ethnicity, NC BRFSS, Combined 2018 and 2019
  • 49 views
  • 5 pdf downloads

View more stats

Abstract

BACKGROUND

Individuals with chronic pain often turn to the health care system for treatment and pain management strategies, but barriers to health care access can make this difficult.

METHODS

We analyzed data from the 2018 and 2019 North Carolina Behavioral Risk Factor Surveillance System (NC BRFSS) surveys to understand whether coping mechanisms for chronic pain differed by specific health care barriers, sex, and race/ethnicity. We assessed 4 health care barriers: coverage barrier (no health insurance), provider barrier (no personal doctor/provider), cost barrier (not seeing a doctor in the past year due to cost), and checkup barrier (no checkup in the past 2 years).

RESULTS

Compared to individuals with no health care barriers, individuals with any health care barrier used coping mechanisms tied to the health care system (e.g., prescription drugs and non-medication pain therapies) less frequently. Differences were also observed by sex and race/ethnicity. Among individuals with or without barriers, men reported using alcohol and marijuana or other street drugs to cope more frequently than women, while women used prescription medications more frequently than men. Among individuals with at least one barrier, Black, non-Hispanic individuals reported using prescription drugs and non-medication pain therapies less frequently than White, non-Hispanic individuals.

LIMITATIONS

The response rate for the NC BRFSS surveys was low, though adjusted for by weighting. We were limited by the available categories for coping mechanisms, and we restricted race/ethnicity analyses to White, non-Hispanic and Black, non-Hispanic individuals.

CONCLUSIONS

Our findings indicate that differences in the use of prescription and non-prescription pain therapies by race/ethnicity for individuals with chronic pain may also be interconnected with health care access barriers.

Introduction

Chronic pain is a critical public health issue in the United States. An estimated 20% of adults in the United States live with chronic pain.1 Those with chronic pain often turn to the health care system for treatment and other pain management strategies, but numerous barriers to health care access, such as cost and lack of insurance, can make this difficult, if not impossible.2 Individuals facing such barriers may use different coping mechanisms that do not require a health care visit, like over-the-counter medications, alcohol, marijuana, and other illicit drugs.

Notably, there are differences in both the prevalence of chronic pain and barriers to health care access by demographics such as race/ethnicity and sex, with women having a higher prevalence of chronic pain than men, and Black, non-Hispanic individuals experiencing more barriers to health care access than White, non-Hispanic individuals, for example.3 Understanding potential differences in chronic pain coping mechanisms by underlying health care barriers and demographics is critical to tailoring interventions and policies focused on supporting equitable access to appropriate care and treatment.

Using population-representative data, we estimated the prevalence of coping mechanisms among adults with chronic pain in North Carolina and examined how these coping mechanisms differed by specific health care barriers, sex, and race/ethnicity. Given unique health care systems and policies (e.g., marijuana legalization) across states, we focused on one state (North Carolina) where marijuana has yet to be legalized for medical or recreational use. This analysis can provide a framework for other states to consider in their efforts to support adults with chronic pain. Additionally, the descriptive and foundational nature of this analysis can inform action to mitigate potential health care barriers experienced by adults with chronic pain and aligns with recent efforts to elevate the value of descriptive epidemiology for addressing public health challenges.4

Methods

We analyzed pooled data from the 2018 and 2019 North Carolina Behavioral Risk Factor Surveillance System (NC BRFSS) surveys. The NC BRFSS is an annual, population-representative survey generated from a probability sample of non-institutionalized North Carolina adults, administered by the Centers for Disease Control and Prevention. Detailed methods are described elsewhere.5 We combined 2018 and 2019 data to calculate average proportions by adjusting the weight variables proportionally by yearly sample size, as recommended by the data documentation.6

In the 2018 and 2019 BRFSS surveys, North Carolina elected to include several state-added questions, including a chronic pain module, which a representative sample population was asked to complete. We identified individuals with chronic pain as those who responded “yes” to the question, “Do you suffer from any type of chronic pain, that is pain that occurs constantly or flares up often?” For those reporting chronic pain, we examined the frequency, severity, and cause. Frequency was measured using responses to the question, “About how often do you experience this pain?” where respondents could choose from 5 set options, ranging from “It’s constant, always there” to “Less often [than once a month].” Severity was measured on a scale from 0 to 10, where “0 means no pain at all and 10 means the worst pain you can imagine” with the question “How severe has your pain usually been over the past 3 months?” Respondents were also asked about the main cause of their chronic pain with no predefined categories.

Individuals who reported chronic pain were asked whether they are “doing anything to cope with [their] chronic pain?” [yes/no]. Among those who reported doing something to cope with their pain, respondents were asked whether or not they used the following 9 mechanisms [yes/no]: 1) “over-the-counter medication like ibuprofen or aspirin,” 2) “a prescription anti-inflammatory like Celebrex,” 3) "a prescription narcotic pain reliever like Percocet or Vicodin,"4) “some other prescription drug,” 5) “a non-medication pain therapy like acupuncture, physical therapy, or yoga,” 6) “alcohol,” 7) “marijuana,” 8) “a street drug other than marijuana,” and 9) “something else.” For our analyses, we combined the categories above into 5 coping mechanisms: over-the-counter medication (answer choice 1), any prescription medication (answer choices 2, 3, and 4 combined), non-medication pain therapy (answer choice 5), alcohol (answer choice 6), and marijuana or other street drugs (answer choices 7 and 8 combined).

We assessed 4 health care access barriers. We considered individuals to have a coverage barrier if they did not report any kind of health care insurance. If individuals lacked at least one person they thought of as their personal doctor or provider, we considered them to report a provider barrier. We considered individuals who indicated that there was a time in the past 12 months when they needed to see a doctor but could not because of cost to report a cost barrier. Finally, we considered individuals to report a checkup barrier if they reported having their last routine checkup more than 2 years prior or never.

We examined coping mechanisms by barrier type among those with chronic pain. We also examined coping mechanisms among those with no barriers and those with one or more barriers, stratified by race/ethnicity and sex. Race and ethnicity are separately measured in the NC BRFSS. Participants were asked to self-classify their race and ethnicity. Race and ethnicity were combined into one variable for analysis, utilizing a combined race/ethnicity measure provided by the BRFSS. Race/ethnicity subgroup analyses were restricted to White, non-Hispanic and Black, non-Hispanic individuals due to well-documented disparities in health care access between these 2 groups, to avoid the use of uninformative, heterogenous categorizations, and due to sample size considerations; the other racial/ethnic categories represented at most 3% of the weighted sample, resulting in very small, unweighted frequencies. We calculated unweighted frequencies and weighted percentages with corresponding 95% confidence intervals (CIs). The recommended BRFSS weighting methodology was used for all prevalence estimates to reduce bias resulting from differing probabilities of selection.6 Consistent with best practice statistical guidance, we examined the magnitude and precision of estimates to discuss potential differences between groups.7,8 All analyses were conducted using SAS version 9.4 (SAS Institute, Cary, NC). This study was considered exempt by the University of North Carolina at Chapel Hill’s Institutional Review Board.

Results

In total, 31.0% (95% CI: 29.7, 32.3) of North Carolina adults experienced chronic pain in 2018–2019. Of those with chronic pain (n = 2225), 58.7% (95% CI: 56.2, 61.3) were women, 71.1% (95% CI: 68.8, 73.5) were White, non-Hispanic, and 20.0% (95% CI: 17.9, 22.1) were Black, non-Hispanic (Table 1). Most reported experiencing chronic pain constantly (52.7%; 95% CI: 50.1, 55.3) and had talked to a health professional about their pain (90.8%; 95% CI: 89.2, 92.3) (Table 2). When ranking their pain 1–10, the median score was 5.5 (SE: 0.1). The most named cause of pain was arthritis (29.8%; 95% CI: 27.5, 32.1), followed by an accident or injury (13.3%; 95% CI: 11.5, 15.1) and sciatic, slipped disk, or spondylosis (12.4%; 95% CI: 10.7, 14.1). Most individuals (n = 1824; 81.0%; 95% CI: 78.9, 83.0) with chronic pain reported doing something to cope. Of the coping mechanisms assessed, over the counter (69.3%; 95% CI: 66.7, 71.9) and prescription medications (53.1%; 95% CI: 50.2, 55.9) were most commonly reported.

Table 1.Demographics for Adults Reporting and Not Reporting Chronic Pain, North Carolina Behavioral Risk Factor Surveillance System, Combined 2018 and 2019
Demographic Characteristic Reports Chronic Pain
(n = 2225)
Reports No Chronic Pain
(n = 4562)
n (%) 95% CI n (%) 95% CI
Age
18 to 24 years old 74 (5.4) 4.1, 6.7 353 (12.5) 11.1, 13.8
25 to 34 years old 160 (10.0) 8.3, 11.6 601 (16.3) 14.9, 17.6
35 to 44 years old 265 (14.4) 12.5, 16.2 639 (16.0) 14.7, 17.3
45 to 54 years old 409 (19.4) 17.3, 21.5 810 (17.0) 15.7, 18.2
55 to 64 years old 541 (23.6) 21.4, 25.7 778 (15.9) 14.6, 17.1
65 years old or older 776 (27.3) 25.1, 29.5 1381 (22.4) 21.0, 23.7
Sex
Male 890 (41.3) 38.7, 43.8 2178 (49.1) 47.3, 50.9
Female 1335 (58.7) 56.2, 61.3 2382 (50.9) 49.1, 52.7
Race/ethnicitya
White, non-Hispanic 1527 (71.1) 68.8, 73.5 2847 (63.0) 61.3, 64.7
Black, non-Hispanic 441 (20.0) 17.9, 22.1 926 (22.2) 20.7, 23.7
Other, non-Hispanic 94 (3.1) 2.2, 4.1 191 (3.8) 3.1, 4.5
Multi-race, non-Hispanic 50 (2.5) 1.7, 3.3 52 (1.3) 0.9, 1.8
Hispanic 83 (3.3) 2.4, 4.1 492 (9.7) 8.7, 10.7
Education
Less than high school 240 (14.6) 12.5, 16.7 500 (14.1) 12.7, 15.5
High school graduate 598 (27.9) 25.6, 30.3 1048 (25.3) 23.7, 26.8
Some college/technical school 749 (37.1) 34.5, 39.6 1300 (32.5) 30.8, 34.2
College/technical school graduate 637 (20.4) 18.6, 22.2 1701 (28.1) 26.7, 29.5
Income
< $15,000 291 (14.5) 12.5, 16.4 265 (7.2) 6.2, 8.3
$15,000 to < $25,000 368 (21.4) 18.9, 23.8 613 (16.6) 15.1, 18.1
$25,000 to < $35,000 223 (11.9) 10.1, 13.7 356 (9.5) 8.4, 10.6
$35,000 to < $50,000 263 (14.5) 12.5, 16.5 522 (14.0) 12.6, 15.3
> $50,000 655 (37.8) 35.0, 40.6 1838 (52.7) 50.7, 54.6
Coverage barrierb
Yes 244 (12.8) 11.0, 14.6 638 (15.2) 13.9, 16.6
No 1980 (87.2) 85.4, 89.0 3913 (84.8) 83.4, 86.1
Provider barrierc
Yes 289 (16.0) 14.0, 18.1 890 (21.9) 20.4, 23.5
No 1932 (84.0) 81.9, 86.0 3662 (78.1) 76.5, 79.6
Cost barrierd
Yes 496 (24.2) 21.9, 26.4 524 (12.6) 11.4, 13.9
No 1722 (75.8) 73.6, 78.1 4033 (87.4) 86.1, 88.6
Checkup barriere
Yes 174 (9.7) 8.1, 11.3 510 (12.7) 11.4, 13.9
No 2030 (90.3) 88.7, 91.9 4010 (87.3) 86.1, 88.6
Total number of health care access barriers
1 Barrier 427 (20.8) 18.7, 22.9 741 (18.0) 16.6, 19.5
2 Barriers 157 (8.1) 6.5, 9.6 428 (10.3) 9.2, 11.4
3 Barriers 94 (4.9) 3.8, 6.1 235 (5.7) 4.8, 6.6
4 Barriers 45 (2.7) 1.8, 3.6 65 (1.6) 1.1, 2.0
No Barriers 1502 (63.5) 61.0, 66.0 3093 (64.3) 62.6, 66.1

Abbreviations: % = weighted percentage; n = unweighted sample size; 95% CI = 95% confidence interval for weighted percentage
Note: Observation totals may not sum to n total due to missing values. Percentages are calculated for non-missing values. Percentages may not sum to 100% due to rounding.
a Race and ethnicity are measured separately in NC BRFSS. Participants are asked to self-classify their race and ethnicity. The race categories in this table, which were also used for analysis, are a combined race/ethnicity measure that is provided by NC BRFSS.
b Coverage barrier is defined as not having any kind of health care coverage.
c Provider barrier is defined as not having at least one person that you think of as your personal doctor or health care provider.
d Cost barrier is defined as having a time in the past 12 months when you needed to see a doctor but could not because of cost.
e Checkup barrier is defined as having last visited a doctor for a routine checkup 2 or more years ago or having never seen a doctor.

Table 2.Chronic Pain Characteristics and Coping Mechanisms Among All Individuals with Chronic Pain (n = 2225), North Carolina Behavioral Risk Factor Surveillance System, Combined 2018 and 2019
Characteristic n (%) 95% CI
Frequency of pain
Constant/always there 1193 (52.7) 50.1, 55.3
At least once a week 531 (24.7) 22.5, 27.0
At least once a day 292 (14.5) 12.6, 16.3
At least once a month 112 (5.0) 3.9, 6.2
Less often 63 (3.0) 2.1, 3.9
Talked to a health care professional about pain
Yes 2040 (90.8) 89.2, 92.3
No 182 (9.2) 7.7, 10.8
Main cause of pain
Migraine 51 (2.9) 2.0, 3.8
Arthritis 700 (29.8) 27.5, 32.1
Sciatic, slipped disk, spondylosis 275 (12.4) 10.7, 14.1
Diabetes 27 (0.9) 0.5, 1.4
Muscle pain 97 (4.7) 3.6, 5.8
Accident or injury 260 (13.3) 11.5, 15.1
Neuropathic pain 89 (4.4) 3.2, 5.6
Otherb 626 (31.6) 29.0, 34.1
Doing something to cope
Yes 1824 (81.0) 78.9, 83.0
No 393 (19.0) 17.0, 21.1
Coping mechanism
Over-the-counter medication 1232 (69.3) 66.7, 71.9
Any prescription drug 975 (53.1) 50.2, 55.9
Non-medication pain therapy 555 (29.9) 27.3, 32.4
Alcohol 81 (4.8) 3.5, 6.1
Marijuana or other street drug 110 (6.1) 4.7, 7.4
Characteristic Median (SE)
Pain Levelb 5.5 (0.1)

Abbreviations: % = weighted percentage; n = unweighted sample size; 95% CI = 95% confidence interval for weighted percentage; SE = standard error
Note: Observation totals may not sum to n total due to missing values. Percentages are calculated for non-missing values. Percentages may not sum to 100% due to rounding.
a ‘Other’ includes cancer, shingles, and other non-specified causes of pain.
b Pain level was ranked on a scale from 1–10 over the past 3 months.

We restricted the following analyses to those with chronic pain and assessed the data for missingness. When reporting whether the individual was doing something to cope, missingness was 0.4%. Among those doing something to cope, missing values were present for between 0.1% to 0.9% of the observations for each barrier type, 1.2% for race/ethnicity, and 0% for sex.

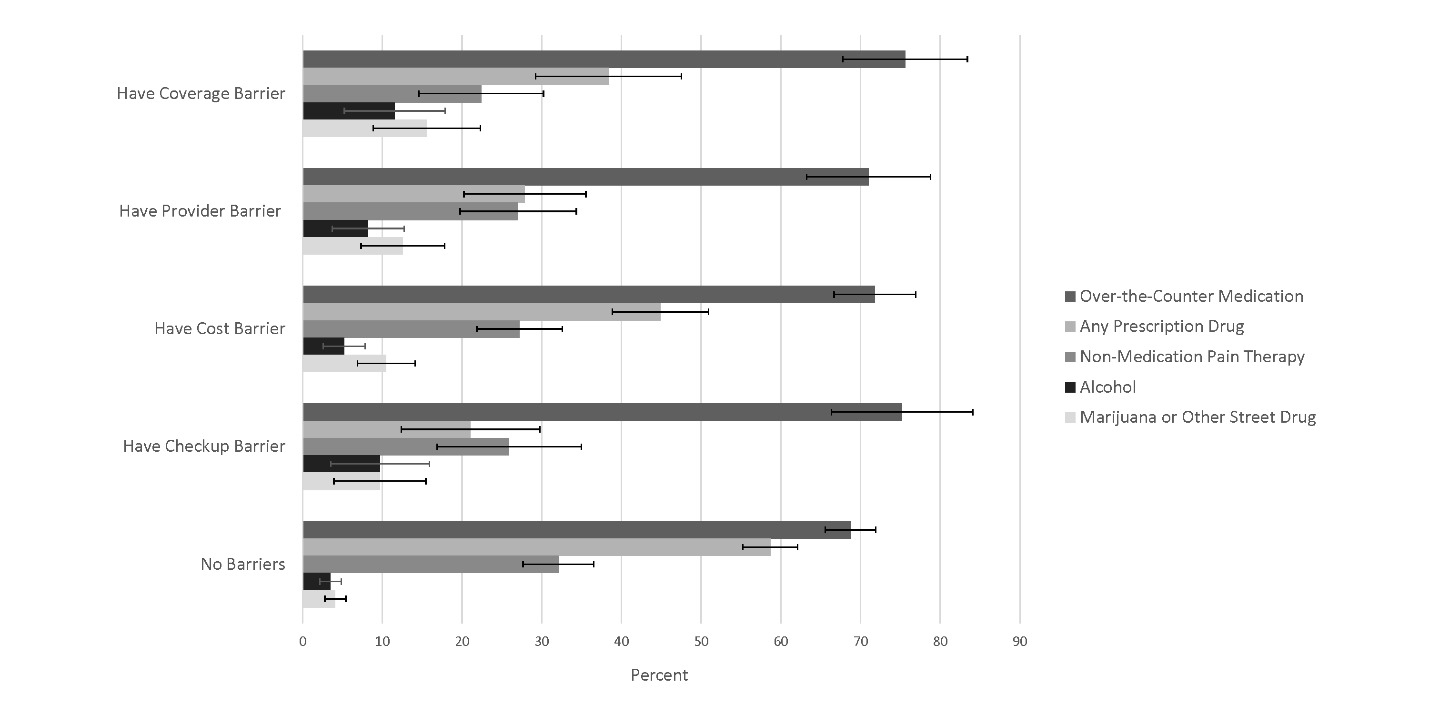
Across each health care access barrier, over-the-counter medication use was the most prevalent coping mechanism among those who reported doing something to cope (Figure 1; Appendix A). Over-the-counter medication use ranged from 71.0% (95% CI: 63.2, 78.8) for those with a provider barrier to 75.6% (95% CI: 67.8, 83.4) for those with a coverage barrier. Prescription drug use was more prevalent among those with no barriers (58.7%; 95% CI: 55.2, 62.1) as compared to those with any barrier. People with a checkup barrier reported the lowest use of prescription drugs at 21.1% (95% CI: 12.4, 29.8). The use of alcohol and marijuana or other street drugs was more prevalent among those experiencing any of the barrier types than for those with no barriers. The use of alcohol as a coping mechanism ranged from 5.2% (95% CI: 2.6, 7.8) for those with a cost barrier to 11.6% (95% CI: 5.2, 17.9) for those with a coverage barrier, compared to 3.5% (95% CI: 2.2, 4.8) for those with no barriers. For marijuana and other street drugs, a similar pattern emerged, with use ranging from 9.7% (95% CI: 3.9, 15.4) for those with a checkup barrier to 15.6% (95% CI: 8.8, 22.3) for those with a coverage barrier, compared to 4.1% (95% CI: 2.8, 5.4) for those with no barriers.

Figure 1
Figure 1.Chronic Pain Coping Mechanism Use Among Individuals with and Without Health Care Access Barriers, NC BRFSS, Combined 2018 and 2019

Note: 12.8% of individuals with chronic pain reported a coverage barrier, 16.0% reported a provider barrier, 24.2% reported a cost barrier, and 9.7% reported a checkup barrier. 63.5% of individuals with chronic pain did not have any health care access barriers. These barriers are not mutually exclusive.

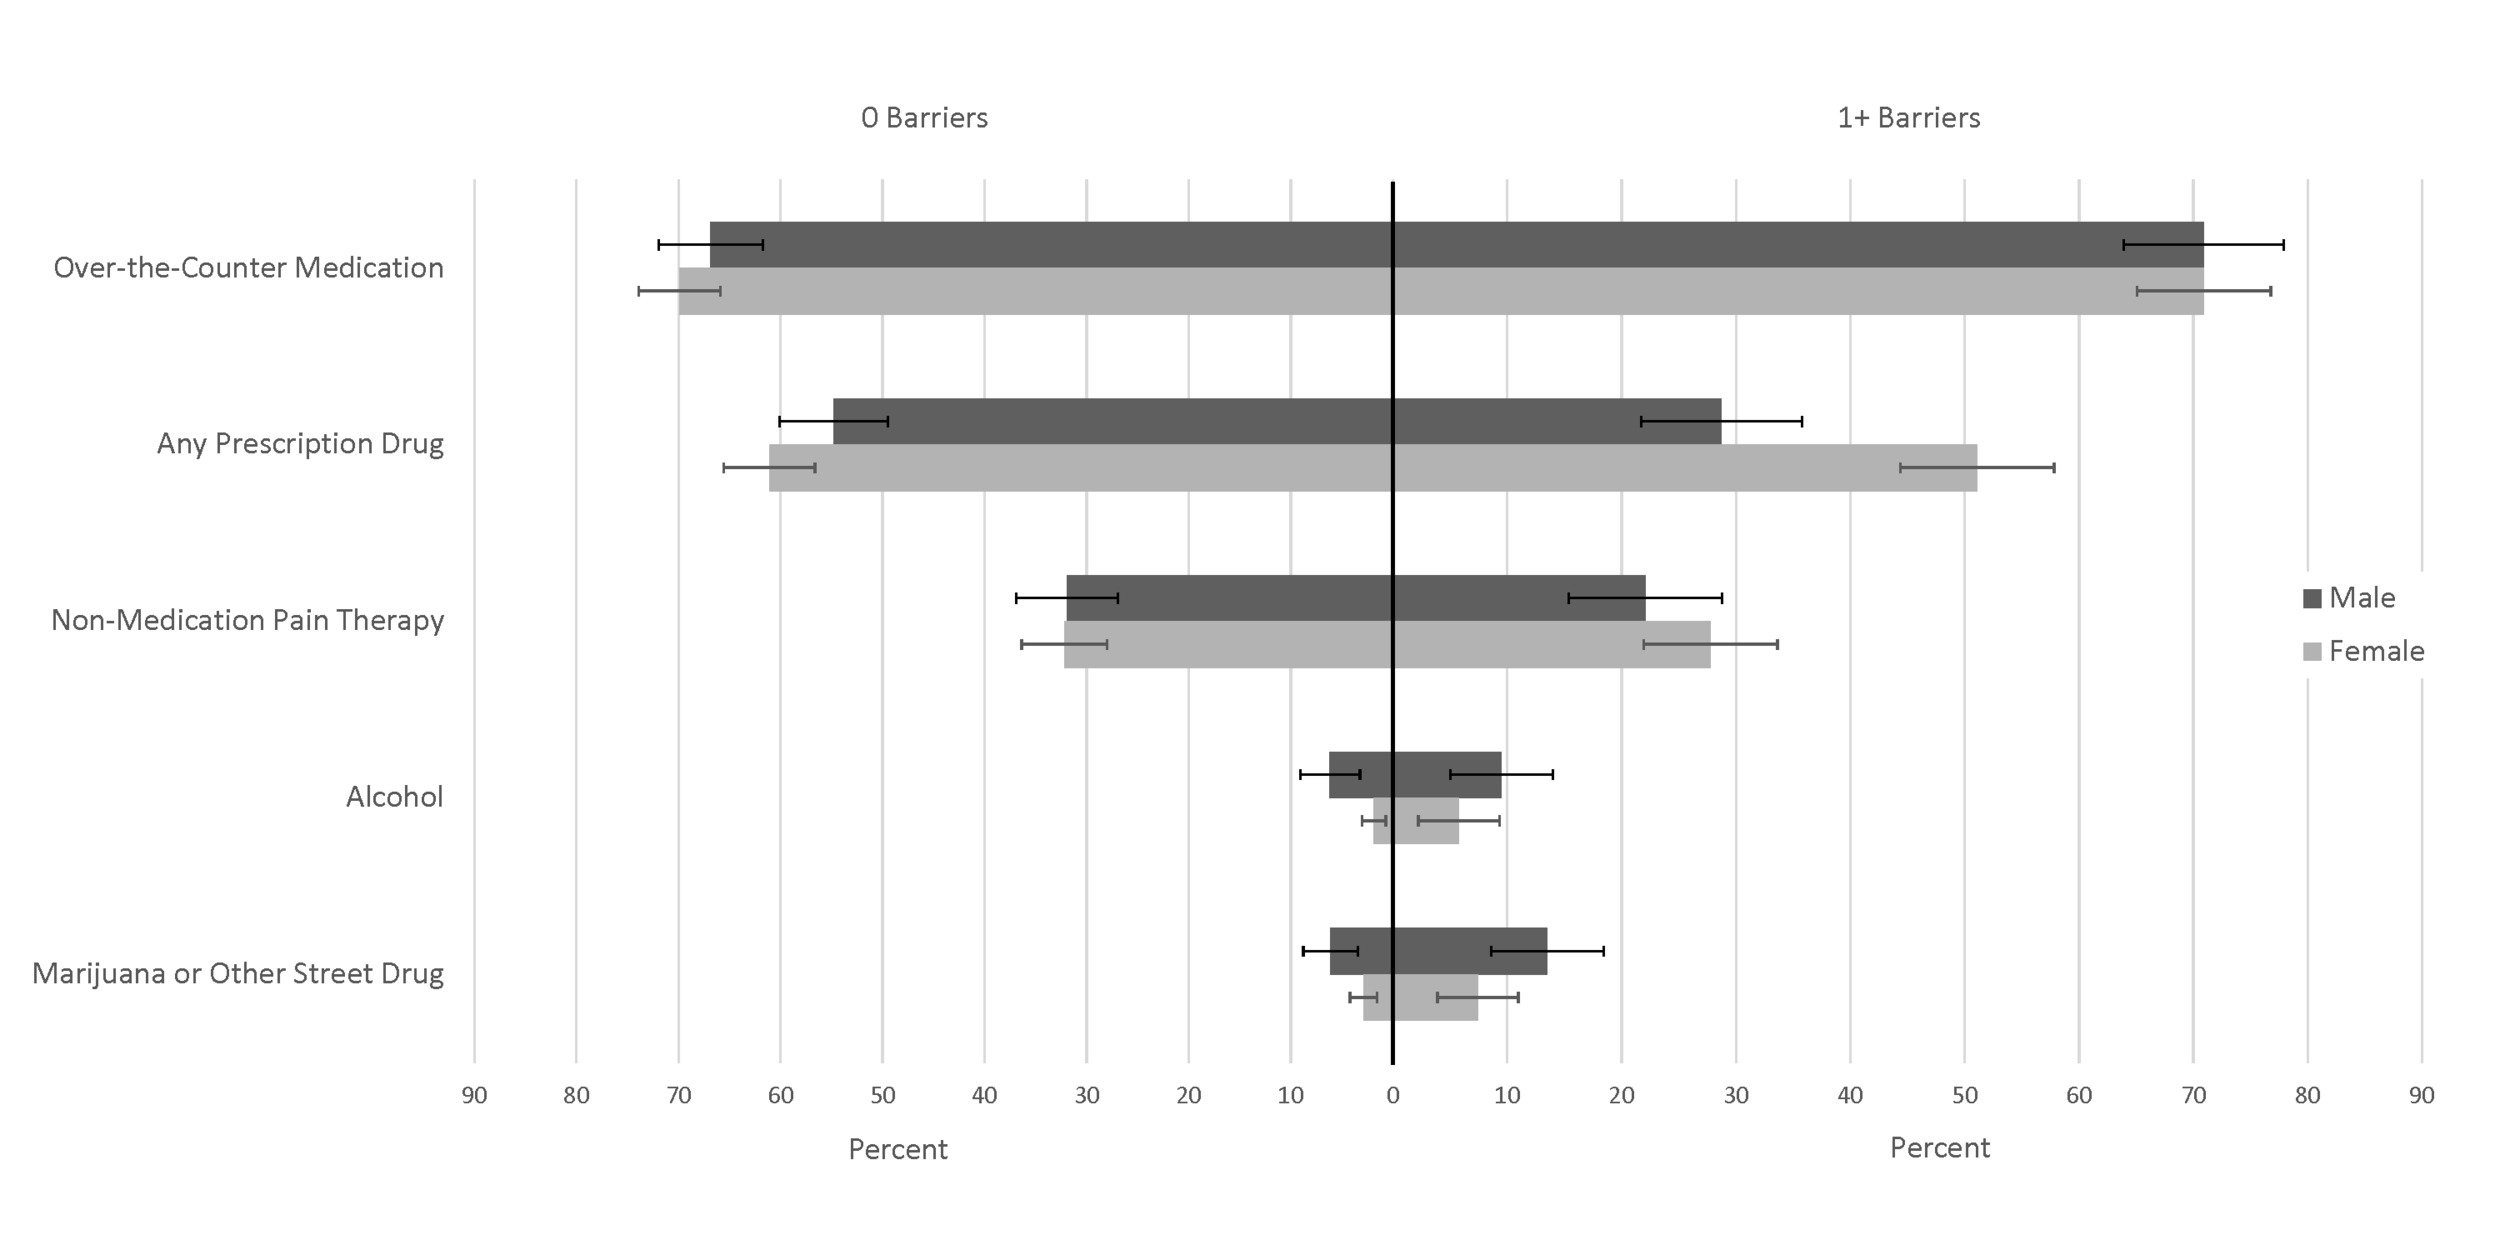
Regardless of the number of health care access barriers, men used alcohol (7.3%; 95% CI: 4.9, 9.8) and marijuana or other street drugs (8.7%; 95% CI: 6.3, 11.2) to cope more frequently than women (alcohol: 3.1%; 95% CI: 1.7, 4.5; marijuana or other street drugs: 4.3%; 95% CI: 2.9, 5.8). Women used prescription medications (57.9%; 95% CI: 54.1, 61.6) more frequently than men (45.6%; 95% CI: 41.2, 50.0). Both men and women with at least one barrier had a higher use of alcohol and marijuana or other street drugs than those with no barriers. Both men and women with no barriers had a higher use of prescription medication and non-medication pain therapies than those with barriers, though the difference was less prominent for women (Figure 2; Appendix B).

Figure 2
Figure 2.Chronic Pain Coping Mechanism Use Among Individuals With and Without Health Care Access Barriers by Sex, NC BRFSS, Combined 2018 and 2019

Note: 1+ barriers include individuals that have at least 1 of the health care access barrier types: coverage, provider, cost, and/or checkup.

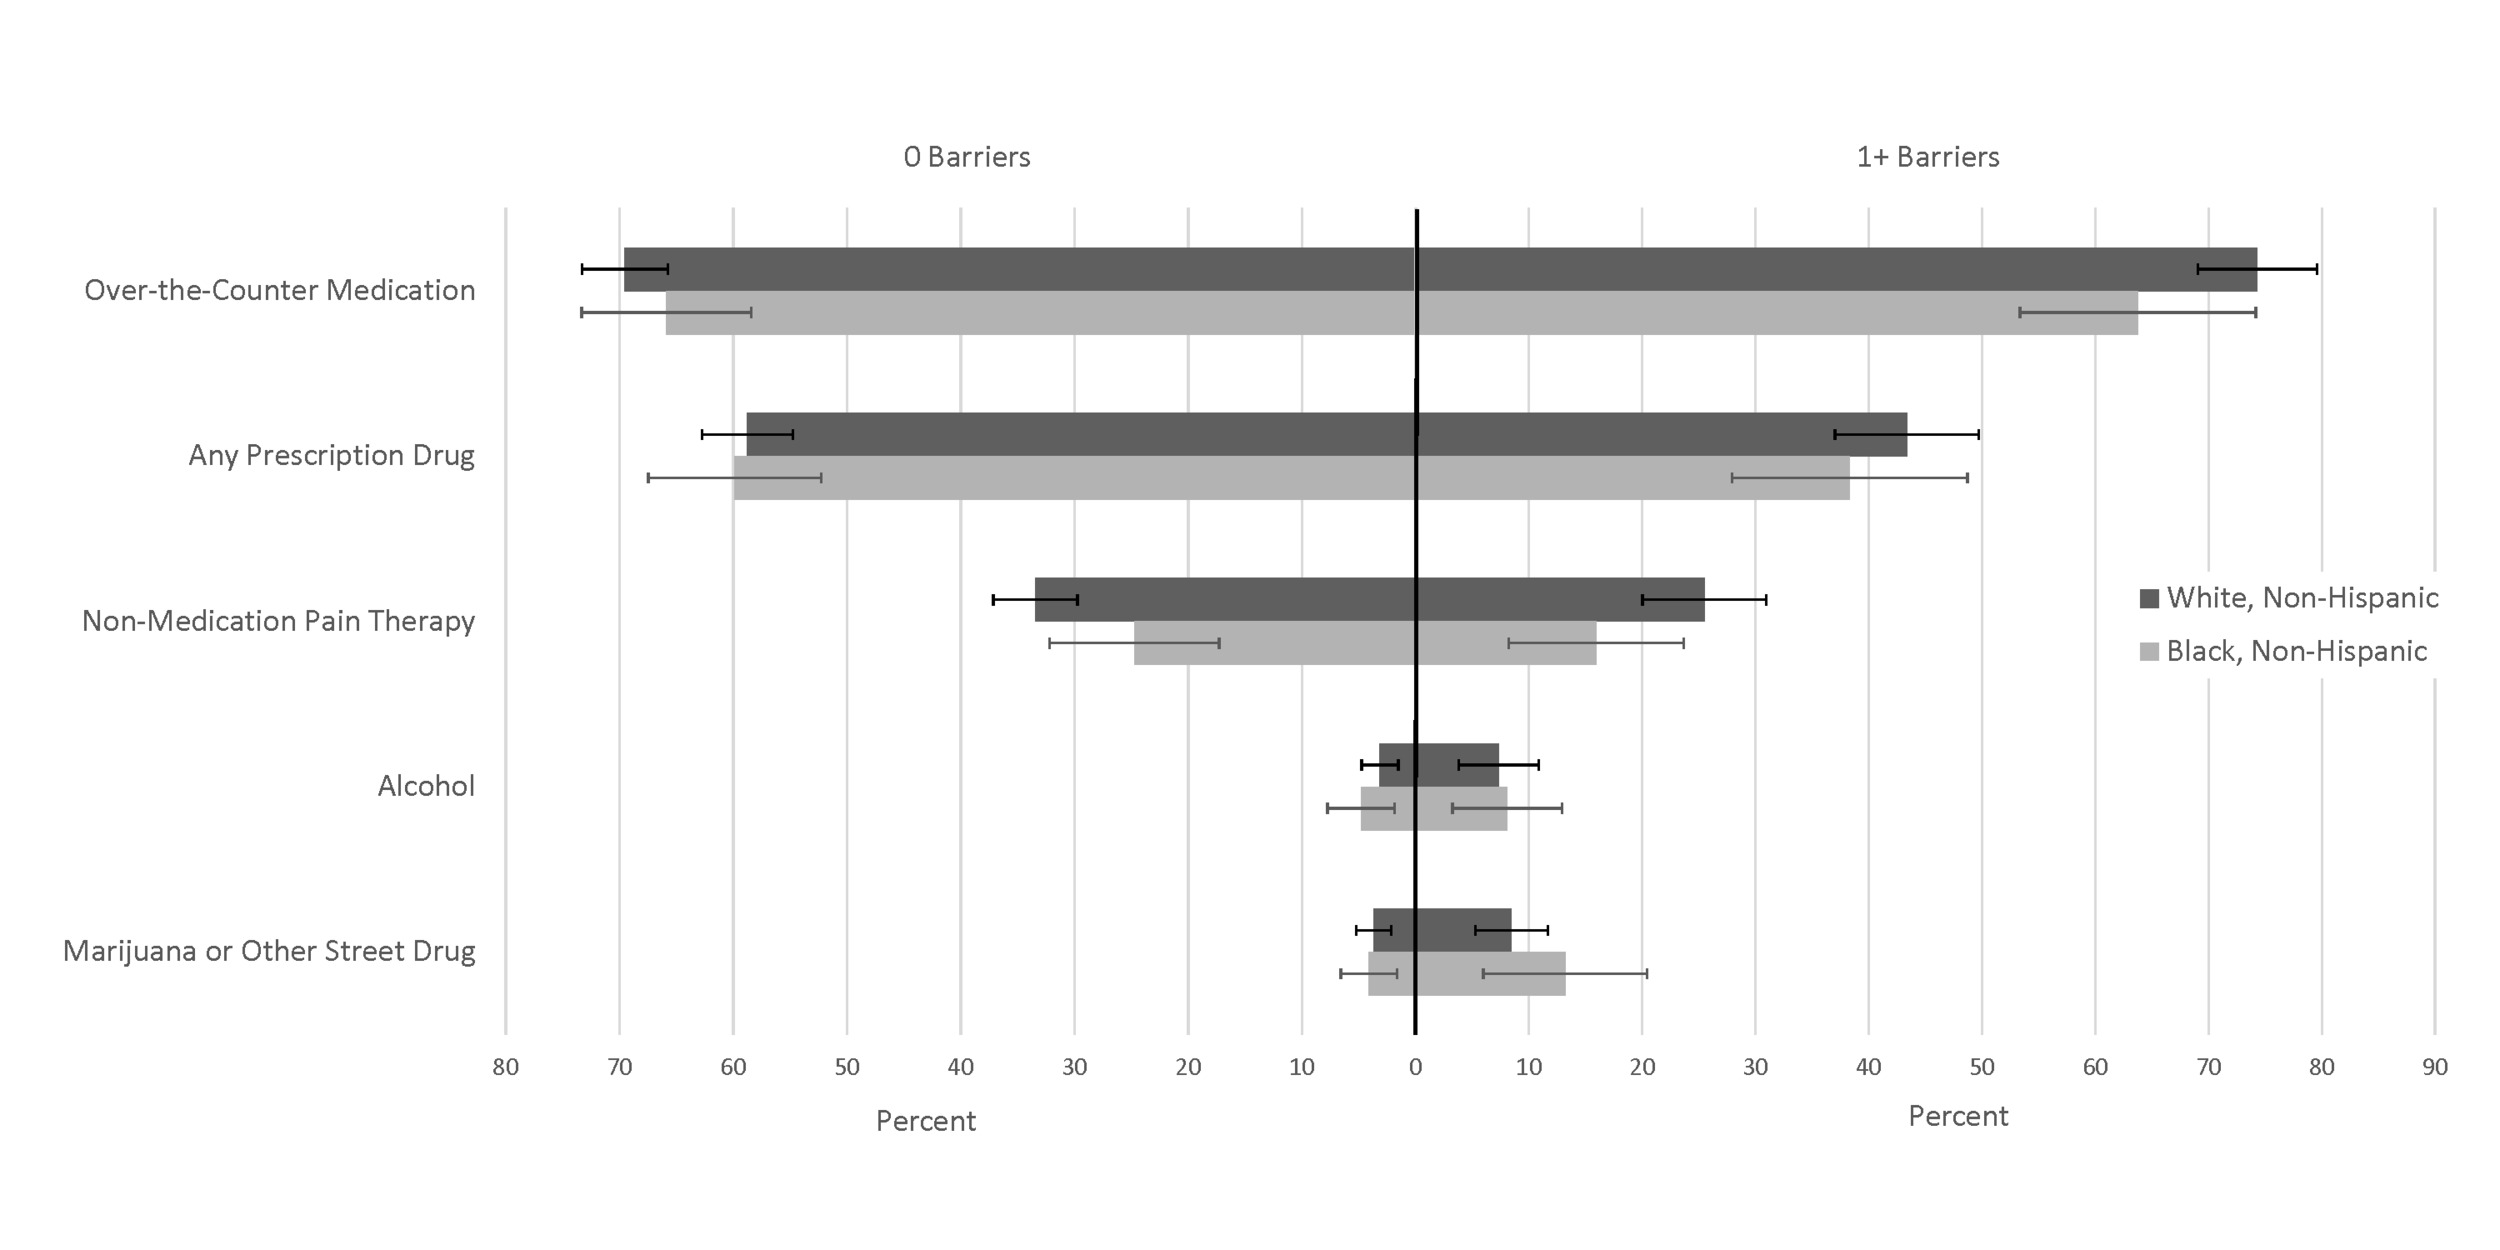
Similarly, both White, non-Hispanic and Black, non-Hispanic individuals were more likely to use alcohol and marijuana or other street drugs if they had at least one health care access barrier and prescriptions, and non-medication pain therapies if they had no barriers (Figure 3; Appendix C). Among individuals with at least one barrier, only 38.3% (95% CI: 27.9, 48.7) of Black, non-Hispanic individuals used prescription drugs and 15.9% (95% CI: 8.2, 23.7) used nonmedication therapies, compared to 43.4% (95% CI: 37.0, 49.7) and 25.5% (95% CI: 20.0, 31.0) of White, non-Hispanic individuals.

Figure 3
Figure 3.Chronic Pain Coping Mechanism Use Among Individuals with and Without Health Care Access Barriers by Race/Ethnicity, NC BRFSS, Combined 2018 and 2019

Note: 1+ barriers include individuals that have at least 1 of the health care access barrier types: coverage, provider, cost, and/or checkup.

Discussion

Nearly 1 in 3 North Carolina adults experienced chronic pain in 2018–2019, which is higher than the estimated national prevalence1 and likely due to differences in the demographic composition of North Carolina, particularly its large rural and aging population.9 Of those individuals, more than 80% reported doing something to cope with pain. Over-the-counter medication use was overwhelmingly the most prevalent coping mechanism among adults with chronic pain; use was reported by about 7 in 10 individuals regardless of whether they had any type of health care access barrier. Despite advancement in evidence-based, non-pharmacological treatments for chronic pain,10 uptake continues to lag behind pharmacological treatments.11 In our data, the use of non-medication pain therapies was reported by 1 in 4 individuals with any of the health care access barriers and by 1 in 3 individuals who reported no barriers. Alcohol and marijuana/other street drugs were only used by around 5%–6% of individuals.

Coping mechanism use varied by health care barrier. Unsurprisingly, individuals with any health care barrier used coping mechanisms tied to the health care system, such as prescription drugs and non-medication pain therapies, less frequently than those with no barriers. Coping mechanisms also varied by sex. Men were more likely to use alcohol and marijuana or other street drugs than women, while women were more likely to use prescription medications. These findings support prior research, which has found that men are more likely to use non-medication substances than women,12 and women are more likely to use prescription medications than men.13

Coping mechanism differences by race/ethnicity indicated that Black, non-Hispanic individuals with at least one health care access barrier were less likely to use prescription drugs and non-medication therapies than White, non-Hispanic individuals. Research has consistently demonstrated differences in prescribing and pain therapy practices by race/ethnicity for individuals with chronic pain, indicating that Black, non-Hispanic individuals are undertreated for pain.14,15 In addition, the impacts of structural racism, including increased barriers to health care access and medical mistreatment for minoritized racial groups,16 likely exacerbates the differences observed by race and may explain the interconnectedness of coping mechanism and health care access barriers by race/ethnicity.

Collectively, results from this descriptive study provide a valuable foundation for understanding barriers to health care access and coping mechanisms used among adults with chronic pain. The most common barrier to health care access among our sample of adults with chronic pain was cost, affecting 1 in 4 individuals. Notably, North Carolina expanded Medicaid in December 2023.17 Prior studies show that Medicaid expansion is associated with reduced out-of-pocket health care costs18 and increased access to care for a variety of chronic conditions.19 Thus, expanded insurance coverage in North Carolina may help to reduce health care access barriers related to cost among those with chronic pain, though specific research in this area is needed. Prescription drugs, including prescription opioids, can be an important component of safe and effective pain management.20 In our sample, prescription drugs were less likely to be used among those with health care barriers, particularly Black, non-Hispanic individuals with health care barriers, while marijuana or other street drugs were more likely to be used among those with health care barriers. Existing research indicates that Medicaid expansion is also associated with more individuals filling prescriptions for opioids that are paid for by Medicaid,21 suggesting that the expansion of Medicaid in North Carolina may help reduce health care access barriers and facilitate access to effective, clinician-led treatments for chronic pain. However, as aforementioned, specific research in this area is needed, particularly to assess if the potential benefits of Medicaid expansion are equally realized for diverse racial and ethnic populations. Last, in our sample, the use of non-medication pain therapy to cope with chronic pain was low among both those with and without health care barriers, particularly for Black, non-Hispanic individuals. There are increasing recommendations for interdisciplinary, multimodal approaches to the treatment of chronic pain that include both over-the-counter and prescription drug use and non-medication therapies, such as physical and psychological therapy.22 However, such treatment approaches are often not equitably implemented across all populations, particularly among minoritized racial and ethnic groups and those experiencing economic disadvantage.15,23–25 Implementation and rigorous evaluation of innovative strategies, such as provider training in non-pharmacological pain treatments, bias, and stigma,11 virtual delivery of multimodal treatments,26 and nationwide insurance coverage expansion for alternative pain therapies,27 are needed to identify ways to improve access to safe and effective multimodal chronic pain management for such populations with longstanding access disparities.

This study has several limitations. The response rate for the NC BRFSS surveys was low (43.5% in 2018 and 40.8% in 2019),5 and the NC BRFSS only surveys adults with access to a landline or cell phone, both of which could bias findings. However, in analyses of BRFSS data, weighting is used to adjust for the probability of selection and for noncoverage and nonresponse.6,28 We were also constrained by the available categories for coping mechanisms (for example, the survey’s grouping of non-medication pain therapies could mask differences across modalities) and were unable to draw conclusions for those who reported using “something else” to cope with their pain. Additionally, our race/ethnicity analyses were limited to White, non-Hispanic and Black, non-Hispanic individuals due to sample size considerations and to avoid extremely heterogeneous group labels like “other” or “multi-race.” This limited our ability to understand additional differences that might exist for other racial/ethnic groups and points to the need for improved collection of race and ethnicity in national surveys to allow for further subgroup analyses. Finally, since this was a cross-sectional study, we were unable to determine temporality between health care barriers and coping mechanisms.

This study adds to the growing literature on chronic pain and provides valuable information on variation in coping mechanisms across demographic groups and interactions with structural and social determinants of health (e.g., health care access). Our findings highlight the importance of addressing inequitable health care barriers for the large population of individuals suffering from chronic pain. Tailored interventions focused on supporting equitable access to appropriate care and treatment may be key to improving quality of life for those with chronic pain.


Acknowledgments

This work was supported by an award from the Centers for Disease Control and Prevention, National Center for Injury Prevention and Control to the North Carolina Division of Public Health (Overdose Data to Action, cooperative agreement #5NU17CE925024-02-00). The authors gratefully acknowledge the time and efforts of the North Carolina residents who responded to the BRFSS surveys. Without their participation, this work would not have been possible.

Disclosure of interests

The authors have no conflicts of interest to declare.

Financial support

Authors from the University of North Carolina at Chapel Hill were funded through a subcontract under this grant (contract #42469).

References

1.
Yong RJ, Mullins PM, Bhattacharyya N. Prevalence of chronic pain among adults in the United States. Pain. 2022;163(2):e328-e332. doi:10.1097/​j.pain.0000000000002291
Google Scholar
2.
Craig KD, Holmes C, Hudspith M, et al. Pain in persons who are marginalized by social conditions. Pain. 2020;161(2):261-265. doi:10.1097/​j.pain.0000000000001719
Google Scholar
3.
Grol-Prokopczyk H. Sociodemographic disparities in chronic pain, based on 12-year longitudinal data. Pain. 2017;158(2):313-322. doi:10.1097/​j.pain.0000000000000762
Google Scholar
4.
Fox MP, Murray EJ, Lesko CR, Sealy-Jefferson S. On the need to revitalize descriptive epidemiology. Am J Epidemiol. 2022;191(7):1174-1179. doi:10.1093/​aje/​kwac056
Google Scholar
5.
Behavioral Risk Factor Surveillance System. Centers for Disease Control and Prevention. August 29, 2023. Accessed December 14, 2023. https:/​/​www.cdc.gov/​brfss/​index.html
6.
Centers for Disease Control and Prevention; U.S. Department of Health and Human Services. The Behavioral Risk Factor Surveillance System (BRFSS) – complex sampling weights and preparing 2018 BRFSS module data for analysis. 2019. Accessed December 14, 2023. https:/​/​www.cdc.gov/​brfss/​annual_data/​2018/​pdf/​Complex-Smple-Weights-Prep-Module-Data-Analysis-2018-508.pdf
7.
Motulsky HJ. Common misconceptions about data analysis and statistics. Journal of Pharmacology and Experimental Therapeutics. 2014;351(1):200-205. doi:10.1124/​jpet.114.219170
Google Scholar
8.
Wasserstein RL, Lazar NA. The ASA statement on p values: Context, process, and purpose. The American Statistician. 2016;70(2):129-133. doi:10.1080/​00031305.2016.1154108
Google Scholar
9.
Rafferty AP, Luo H, Egan KL, Bell RA, Gaskins Little NR, Imai S. Rural, suburban, and urban differences in chronic pain and coping among adults in North Carolina: 2018 behavioral risk factor surveillance system. Prev Chronic Dis. 2021;18:E13. doi:10.5888/​pcd18.200352
Google Scholar
10.
Shi Y, Wu W. Multimodal non-invasive non-pharmacological therapies for chronic pain: Mechanisms and progress. BMC Med. 2023;21(1):372. doi:10.1186/​s12916-023-03076-2
Google Scholar
11.
Becker WC, Dorflinger L, Edmond SN, Islam L, Heapy AA, Fraenkel L. Barriers and facilitators to use of non-pharmacological treatments in chronic pain. BMC Fam Pract. 2017;18(1):41. doi:10.1186/​s12875-017-0608-2
Google Scholar
12.
Key Substance Use and Mental Health Indicators in the United States: Results from the 2019 National Survey on Drug Use and Health. Substance Abuse and Mental Health Services Administration; 2020. Accessed December 14, 2023. https:/​/​www.samhsa.gov/​data/​
13.
Martin CB, Hales CM, Gu Q, Ogden CL. Prescription drug use in the United States, 2015–2016. NCHS Data Brief. 2019;334:1-8.
Google Scholar
14.
Ringwalt C, Roberts AW, Gugelmann H, Skinner AC. Racial disparities across provider specialties in opioid prescriptions dispensed to Medicaid beneficiaries with chronic noncancer pain. Pain Med. 2015;16(4):633-640. doi:10.1111/​pme.12555
Google Scholar
15.
Anderson KO, Green CR, Payne R. Racial and ethnic disparities in pain: Causes and consequences of unequal care. J Pain. 2009;10(12):1187-1204. doi:10.1016/​j.jpain.2009.10.002
Google Scholar
16.
Morais CA, Aroke EN, Letzen JE, et al. Confronting racism in pain research: A call to action. J Pain. 2022;23(6):878-892. doi:10.1016/​j.jpain.2022.01.009
Google Scholar
17.
U.S. Department of Health and Human Services. 600,000 North Carolinians now have access to Medicaid expansion coverage. HHS Press Office. December 1, 2023. https:/​/​www.hhs.gov/​about/​news/​2023/​12/​01/​nearly-600-000-north-carolinians-now-have-access-medicaid-expansion-coverage.html
18.
Abramowitz J. The effect of ACA state Medicaid expansions on medical out-of-pocket expenditures. Med Care Res Rev. 2020;77(1):19-33. doi:10.1177/​1077558718768895
Google Scholar
19.
Rosland AM, Kieffer EC, Tipirneni R, et al. Diagnosis and care of chronic health conditions among Medicaid expansion enrollees: A mixed-methods observational study. J Gen Intern Med. 2019;34(11):2549-2558. doi:10.1007/​s11606-019-05323-w
Google Scholar
20.
Cohen SP, Vase L, Hooten WM. Chronic pain: An update on burden, best practices, and new advances. Lancet. 2021;397(10289):2082-2097. doi:10.1016/​S0140-6736(21)00393-7
Google Scholar
21.
Saloner B, Levin J, Chang HY, Jones C, Alexander GC. Changes in buprenorphine-naloxone and opioid pain reliever prescriptions after the Affordable Care Act Medicaid expansion. JAMA Netw Open. 2018;1(4):e181588. doi:10.1001/​jamanetworkopen.2018.1588
Google Scholar
22.
Eucker SA, Knisely MR, Simon C. Nonopioid treatments for chronic pain—integrating multimodal biopsychosocial approaches to pain management. JAMA Netw Open. 2022;5(6):e2216482. doi:10.1001/​jamanetworkopen.2022.16482
Google Scholar
23.
Zheng P, Kao MC, Karayannis NV, Smuck M. Stagnant physical therapy referral rates alongside rising opioid prescription rates in patients with low back pain in the United States 1997–2010. Spine. 2017;42(9):670-674. doi:10.1097/​BRS.0000000000001875
Google Scholar
24.
Maly A, Vallerand AH. Neighborhood, socioeconomic, and racial influence on chronic pain. Pain Manag Nurs. 2018;19(1):14-22. doi:10.1016/​j.pmn.2017.11.004
Google Scholar
25.
Nahin RL, Stussman BJ, Herman PM. Out-of-pocket expenditures on complementary health approaches associated with painful health conditions in a nationally representative adult sample. J Pain. 2015;16(11):1147-1162. doi:10.1016/​j.jpain.2015.07.013
Google Scholar
26.
Fritz JM, Davis AF, Burgess DJ, et al. Pivoting to virtual delivery for managing chronic pain with nonpharmacological treatments: Implications for pragmatic research. Pain. 2021;162(6):1591-1596. doi:10.1097/​j.pain.0000000000002139
Google Scholar
27.
Choo EK, Charlesworth CJ, Gu Y, Livingston CJ, McConnell KJ. Increased use of complementary and alternative therapies for back pain following statewide Medicaid coverage changes in Oregon. J Gen Intern Med. 2021;36(3):676-682. doi:10.1007/​s11606-020-06352-6
Google Scholar
28.
Dutwin D, Buskirk TD. Telephone sample surveys: Dearly Beloved or nearly departed? Trends in survey errors in the era of declining response rates. J Survey Statistics and Methodology. 2020;9(3):353-380. doi:10.1093/​jssam/​smz044
Google Scholar


Appendix A.Chronic Pain Coping Mechanisms Among Individuals with and Without Health Care Access Barriers, North Carolina Behavioral Risk Factor Surveillance System, Combined 2018 and 2019
Report Using Over-the-Counter Medication
% (95% CI)
Report Using Any Prescription Drug
% (95% CI)
Report Using Non-Medication Pain Therapy
% (95% CI)
Report Using Alcohol
% (95% CI)
Report Using Marijuana or Other Street Drug
% (95% CI)
Have coverage barrier 75.6
(67.8, 83.4)
38.4
(29.2, 47.5)
22.4
(14.6, 30.2)
11.6
(5.2, 17.9)
15.6
(8.8, 22.3)
Have provider barrier 71.0
(63.2, 78.8)
27.9
(20.2, 35.5)
27.0
(19.7, 34.3)
8.2
(3.7, 12.7)
12.6
(7.3, 17.8)
Have cost barrier 71.8
(66.7, 76.9)
44.9
(38.8, 50.9)
27.2
(21.9, 32.6)
5.2
(2.6, 7.8)
10.5
(6.9, 14.1)
Have checkup barrier 75.2
(66.3, 84.1)
21.1
(12.4, 29.8)
25.9
(16.8, 35.0)
9.7
(3.5, 15.9)
9.7
(3.9, 15.4)
Have no barriers 68.7
(65.6, 71.9)
58.7
(55.2, 62.1)
32.1
(28.9, 35.3)
3.5
(2.2, 4.8)
4.1
(2.8, 5.4)

Abbreviations: % = weighted percentage; 95% CI = 95% confidence interval for weighted percentage
Note: 12.9% of individuals with chronic pain reported a coverage barrier, 16.2% reported a provider barrier, 24.2% reported a cost barrier, and 9.8% reported a checkup barrier. 63.4% of individuals with chronic pain did not have any health care access barriers. These barriers are not mutually exclusive.
Example interpretation for this table: “Among those with a coverage barrier, 75.6% (95% CI: 67.9, 83.4) use over-the-counter medication to cope with their chronic pain.”

Appendix B.Chronic Pain Coping Mechanism Use Among Individuals with and Without Health Care Access Barriers by Sex, North Carolina Behavioral Risk Factor Surveillance System, Combined 2018 and 2019
Report Using Over-the-Counter Medication
% (95% CI)
Report Using Any Prescription Drug
% (95% CI)
Report Using Non-Medication Pain Therapy
% (95% CI)
Report Using Alcohol
% (95% CI)
Report Using Marijuana or Other Street Drug
% (95% CI)
Male
Have coverage barrier 74.3
(63.6, 85.0)
18.6
(8.3, 28.9)
20.4
(9.5, 31.4)
11.0
(4.1, 18.0)
17.2
(8.5, 25.9)
Have provider barrier 71.9
(61.3, 82.6)
18.2
(10.0, 26.3)
20.3
(11.2, 29.3)
12.4
(4.8, 20.0)
18.2
(9.9, 26.4)
Have cost barrier 72.3
(63.5, 81.0)
33.2
(23.8, 42.6)
21.2
(12.9, 29.4)
6.6
(2.4, 10.8)
14.8
(8.2, 21.5)
Have checkup barrier 70.2
(56.8, 83.5)
13.1
(3.6, 22.6)
17.9
(7.3, 28.6)
13.9
(3.5, 24.4)
12.9
(3.3, 22.5)
Have one or more barriers 70.9
(63.9, 77.9)
28.8
(21.7, 35.8)
22.1
(15.4, 28.8)
9.5
(5.0, 14.0)
13.5
(8.6, 18.4)
Have no barriers 66.8
(61.7, 72.0)
54.8
(49.5, 60.1)
31.9
(26.9, 36.9)
6.2
(3.2, 9.1)
6.1
(3.4, 8.8)
Female
Have coverage barrier 76.7
(65.4, 88.0)
55.8
(43.1, 68.6)
24.1
(13.0, 35.3)
12.0
(1.9, 22.2)
14.1
(4.0, 24.2)
Have provider barrier 69.9
(58.6, 81.2)
38.9
(26.5, 51.3)
34.7
(23.2, 46.3)
3.5
(0.0, 7.6)
6.3
(0.2, 12.3)
Have cost barrier 71.5
(65.2, 77.9)
51.4
(43.8, 59.0)
30.6
(23.7, 37.6)
4.4
(1.0, 7.8)
8.1
(3.8, 12.3)
Have checkup barrier 81.2
(70.9, 91.6)
30.6
(16.0, 45.3)
35.5
(20.6, 50.4)
4.6
(0.2, 9.1)
5.9
(1.1, 10.6)
Have one or more barriers 70.2
(64.4, 76.1)
51.1
(44.4, 57.8)
27.8
(21.9, 33.6)
5.8
(2.2, 9.3)
7.4
(3.9, 11.0)
Have no barriers 69.9
(65.9, 73.9)
61.0
(56.6, 65.6)
32.2
(28.0, 36.4)
1.9
(0.7, 3.0)
2.9
(1.5, 4.2)

Abbreviations: % = weighted percentage; 95% CI = 95% confidence interval for weighted percentage
Example interpretation for this table: “Among those who have a coverage barrier who are male, 74.3% (95% CI: 63.6, 85.0) use over-the-counter medication to cope with their chronic pain.”

Appendix C.Chronic Pain Coping Mechanism Use Among Individuals with and Without Health Care Access Barriers by Race/Ethnicity, North Carolina Behavioral Risk Factor Surveillance System, Combined 2018 and 2019
Report Using Over-the-Counter Medication
% (95% CI)
Report Using Any Prescription Drug
% (95% CI)
Report Using Non-Medication Pain Therapy
% (95% CI)
Report Using Alcohol
% (95% CI)
Report Using Marijuana or Other Street Drug
% (95% CI)
White, non-Hispanic
Have coverage barrier 88.5
(82.4, 94.6)
31.1
(19.9, 42.3)
23.2
(12.8, 33.5)
13.4
(4.7, 22.1)
18.5
(9.5, 27.5)
Have provider barrier 76.0
(67.0, 85.1)
29.6
(19.8, 39.3)
27.1
(17.9, 36.3)
9.1
(2.7, 15.6)
11.1
(4.9, 17.3)
Have cost barrier 74.6
(68.4, 80.8)
47.5
(39.7, 55.4)
28.1
(21.1, 35.1)
3.4
(1.2, 5.7)
7.7
(4.1, 11.3)
Have checkup barrier 79.7
(69.6, 89.9)
26.3
(14.6, 38.0)
16.2
(6.8, 25.7)
9.5
(1.1, 17.8)
7.1
(2.0, 12.1)
Have one or more barriers 74.3
(69.0, 79.6)
43.4
(37.0, 49.7)
25.5
(20.0, 31.0)
7.3
(3.8, 10.8)
8.5
(5.3, 11.7)
Have no barriers 69.5
(65.8, 73.3)
58.7
(54.8, 62.7)
33.4
(29.7, 37.1)
3.1
(1.5, 4.8)
3.7
(2.1, 5.2)
Black, non-Hispanic
Have coverage barrier 63.9
(45.4, 82.4)
44.3
(26.3, 63.3)
5.6
(0.0, 12.2)
7.0
(0.0, 14.2)
6.4
(0.0, 15.7)
Have provider barrier 61.2
(43.8, 78.7)
29.8
(13.2, 46.3)
22.1
(7.7, 36.6)
8.3
(0.5, 16.2)
19.7
(6.0, 33.5)
Have cost barrier 70.1
(59.2, 81.0)
37.0
(25.6, 48.5)
16.3
(7.6, 25.0)
7.5
(2.2, 12.8)
13.3
(4.9, 21.7)
Have checkup barrier 64.9
(40.5, 89.3)
6.5
(0.0, 15.7)
27.8
(3.7, 51.9)
18.0
(2.4, 33.7)
27.9
(3.5, 52.3)
Have one or more barriers 63.8
(53.3, 74.2)
38.3
(27.9, 48.7)
15.9
(8.2, 23.7)
8.1
(3.2, 12.9)
13.2
(6.0, 20.4)
Have no barriers 65.9
(58.4, 73.3)
59.9
(52.2, 67.5)
24.7
(17.3, 32.2)
4.8
(1.9, 7.8)
4.1
(1.6, 6.6)

Abbreviations: % = weighted percentage; 95% CI = 95% confidence interval for weighted percentage
Example interpretation for this table: “Among those with a coverage barrier who are White, non-Hispanic, 88.5% (95% CI: 82.4, 94.6) use over-the-counter medication to cope with their chronic pain.”