


Introduction
Delivering high-quality diabetes care to underprivileged children is a priority for North Carolina’s health systems. However, practices across the state continue to have a steep learning curve as they struggle to maintain financial footing during the Medicaid transformation and continue to recover from the COVID-19 pandemic. As of February 2024, the North Carolina Department of Health and Human Services (NCDHHS) Medicaid program provides health care to approximately 1.3 million children.1 Children with Medicaid are at higher risk for inadequate care and poorer health outcomes due to the many social and economic barriers they experience. Connecting them with their diabetes care team using telehealth has provided many children a way to bypass hurdles to care. Previously, diabetes care teams received minimal reimbursement for telehealth but continued to use it as one of the best avenues to reach patients.
In response to the COVID-19 pandemic, Medicaid programs nationwide experienced unprecedented changes to their reimbursement policies, widening the availability of such services. While the transition saved many families the risk of an in-person clinic visit, it also validated a new pathway for diabetes care delivery. Under more typical circumstances, it takes substantial time to implement transitions in health care delivery methods and to analyze cost implications. However, the acceptance of telehealth changed rapidly in response to the crisis, and now health care systems and practices are beginning to assess financial impacts. In March 2020, the federal expansion rules for telehealth allowed ambulatory practices struggling with reduced revenue due to fewer in-person clinic visits to receive the same reimbursement rate for telehealth visits.2 For example, a level 4 in-clinic visit for an established Medicaid patient requiring a high level of medical decision-making (current procedural terminology [CPT] 99215) has the same reimbursement as a video visit with the same level of medical decision-making.3
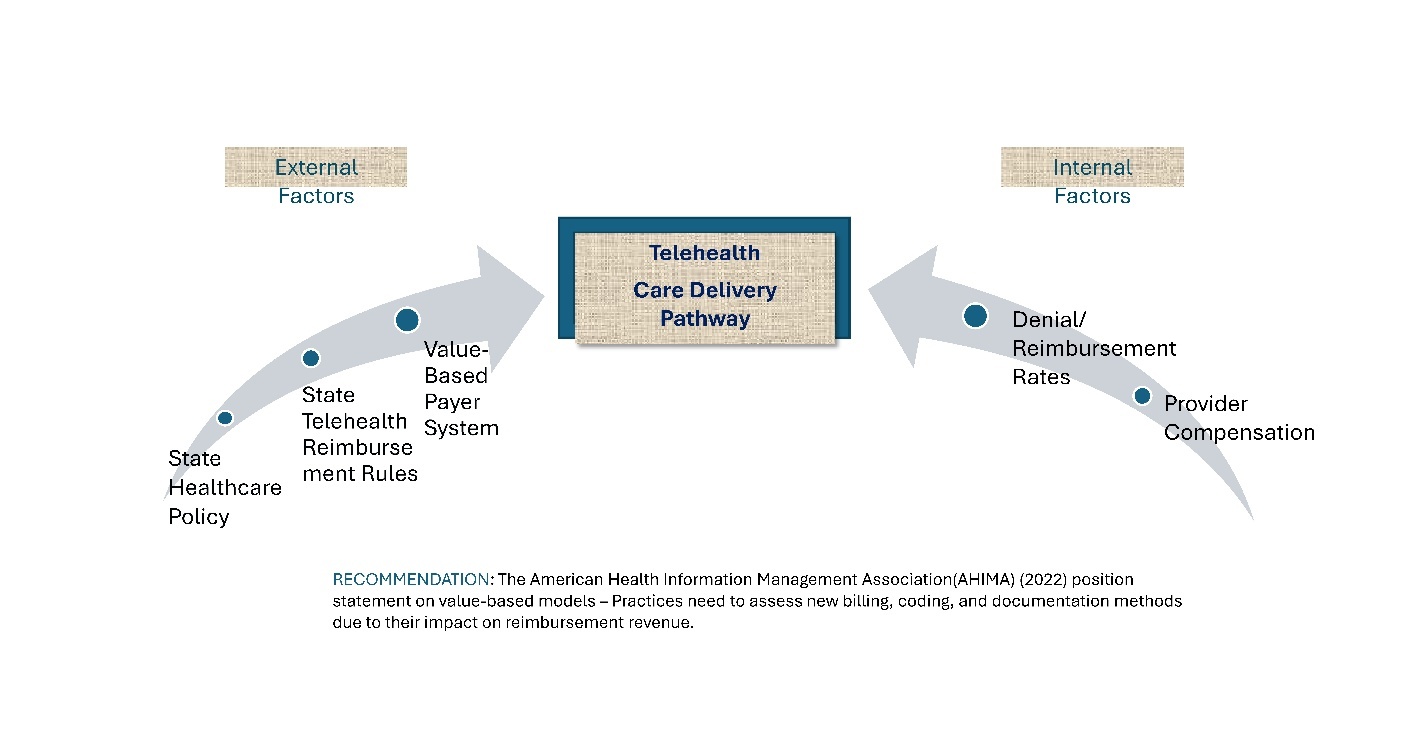
In November of the same year, the North Carolina Medicaid program agreed to continue reimbursement for telehealth visits after the pandemic ended. At the time, North Carolina’s Medicaid system entailed a fee-for-service reimbursement structure only to change in July 2021 when the state began transitioning to a managed care model. This is important because Medicaid began reimbursing providers using a value-based payment system. The Medicaid transformation had been pending legislative approval since its proposal in 2017, and the timing of its implementation was unrelated to the pandemic. Specifically, NCDHHS contracted with 5 different prepaid health plans (PHPs) to improve the quality of health services and cut costs for the state. Those plans are AmeriHealth Caritas, Healthy Blue, UnitedHealthcare (UHC) Community Plan, WellCare, and Carolina Complete. Instead of a volume-based payment model like fee-for-service, the PHPs reimburse providers using a value-based payment (VBP) structure, which sets a predetermined price for everyone’s care plan.4 These overlapping policy shifts have financial implications for any practice developing a telehealth program, and practices should develop their strategies carefully (Figure 1). For more information on value-based payment considerations, see Appendix A.
The project focuses on children with diabetes in North Carolina’s Medicaid system for several reasons. First, new-onset pediatric diabetes dramatically spiked in North Carolina during the pandemic. A retrospective Duke University study collected incidence data for children seen with type 1 and type 2 diabetes mellitus (DM). In 2020 and 2021, there was a sharp rise (48%) in cases of type 1 diabetes as opposed to an average of 31% in 2018 and 2019.5 In the same study, type 2 diabetes cases rose 231%, where researchers observed pre-pandemic averages of 16–17 cases per year rise to an average of 53 cases per year during the pandemic.5 These local trends mimicked increasing trends for both type 1 and type 2 diabetes in children noted on a national level.6 Second, Medicaid patients experience more barriers to proper health care, such as a lack of transportation, limited finances, less stability in the home, and poor school attendance. Telehealth is instrumental in bypassing these barriers, providing more opportunities for a patient to receive care.7 A 2023 study examined the difference in three quality-of-care measures for Medicaid patients with diabetes who received frequent telehealth compared to a group who received less. Specifically, there was a 5.6 percentage point decrease (95% CI 9.7–1.5; P = .008) in blood pressure and a 10.7 percentage point increase (95% CI 6.3–15.0; P < .001) in annual retinal exam rates.8 Hermanns and colleagues (2020) summarize that frequency and duration of contact between the patient and their diabetes team can improve glycemic control and self-care behaviors.9
There are several methods to evaluate the economic impact of telehealth delivery within a practice. Previous studies have assessed telehealth’s benefits and feasibility using more traditional cost analyses and random control trial methods.10 This quality improvement project takes a different approach, allowing a “bottom-up” view of a practice’s billing and reimbursement activities. The project addressed 3 study objectives and performed an evaluation called a cost-consequence analysis (CCA).
The primary objective of using the CCA was to compare the percentage of denied diabetes claims for telehealth visits to in-clinic visits billed to NC Medicaid in a fiscal year. The second essential objective in the study using a CCA approach was to compare provider work relative value units (RVUs) for telehealth and in-clinic visits. Work RVU, often shortened to “wRVU,” is a measurement attached to each procedure or action billed by a provider. It accounts for “the level of technical skills, physical effort, mental effort and judgment, stress related to patient risk, and the amount of time required to perform the service or procedure.”11 Provider workload and claim submissions are vital to understanding the analysis because they are typically the costliest activities within a health care practice. In 1992, Medicare began using the resource-based relative value scale (RBRVS) to determine provider payment based on the amount of work (wRVUs), the practice’s expense, and the liability insurance required for service or procedure.11 This system remains in use today, and this analysis considers wRVUs separately from the practice’s expenses and liability insurance. Work RVUs can differ due to visit type, such as an initial physical exam versus a follow-up visit for an established patient. Exploring the difference in a provider’s effort using RVUs allows us to quantify the work required to sustain a new health care delivery system like telehealth.
The third objective of the study determined patient “no-show” rates for scheduled telehealth and in-clinic visits, which is beneficial since it can worsen the issue of lost revenue for a practice and lead to poor patient outcomes. A 2021 study compared missed appointment rates in a cohort of diabetes patients seen in the clinic during pre-pandemic times to patients seen for telehealth visits during the pandemic. There was no significant difference between the two groups’ rates at the time of the study.12 Telehealth was essential for access to medical care during the pandemic; knowing how patients prefer to access their medical care after the pandemic is critical in predicting the economic health of the practice.
The final step of the project was a simple CCA comparing cost variables and health outcomes. The information generated by the project’s objectives served as an important data source for this step.
Methods
The guiding framework for implementing the quality improvement (QI) project includes strategies used by public health economists. The US Centers for Disease Control and Prevention (CDC) uses an economic evaluation called a CCA, which measures disaggregated costs and a range of outcomes to make inferences. The CCA describes two alternative diabetes care delivery pathways, telehealth and in-clinic, and displays them in a chart.13 This analysis method is more easily understood and allows for a broader range of health and non-health benefits to be measured and compared. It differs from a cost-benefit analysis, where the comparison is usually between monetary units like cost versus revenue. The CCA for this project compares the costs of lost revenue due to denied claims, coupled with compensation for a provider’s work (wRVUs), with the chosen patient-centered outcome represented as mean no-shows and corresponding rates.
The resulting output for this QI study’s objectives was interpreted using the appropriate descriptive statistics: mean, standard deviation, and 95% confidence interval (CI). The claims data was initially sorted based on CPT codes indicating low, moderate, or high medical decision-making, and followed by a designated care delivery pathway. Work RVUs for each claim were sorted in the same way and compared. Further, the average wRVUs for type 1 and type 2 diabetes claims submitted under each care delivery pathway were calculated and compared. As a next step in the analysis, a separate query generated the number of completed visits and reported no-shows for all patients, with and without diabetes, in the same time frame as the queried claims. The statistical analysis for the difference in no-show rates between both telehealth and in-clinic visits included descriptive statistics and an independent t-test using SPSS© software.
An essential first step of the CCA was to standardize the cost of the workload or “RVU compensation” and the lost revenue as if there were an equal number of claims submitted for both delivery care pathways. RVU compensation was calculated by multiplying the mean wRVUs by a conversion factor provided by the Centers for Medicare & Medicaid Services.11 The conversion factor varies depending on the medical specialty of the provider. For simplicity, the analysis used the conversion factor (in dollars) that became effective on January 1, 2022. The RVU compensation was then multiplied by a standard number of claims. The lost revenue due to denials was added to each corresponding pathway to show the total cost burden. For this CCA, the mean missed appointment rates represent a measurable patient outcome. Although a multitude of other health outcomes can apply, this particular outcome is critical because a decline in missed appointments indicates increased care engagement and possible impact on health outcomes.
Data Collection
A billing query collected diabetes claim submission data for an outpatient pediatric endocrinology practice that sees approximately 7500 diabetes patients annually, 35% of whom are Medicaid patients. The practice is part of a larger health care network located in a metropolitan area centrally located in North Carolina. The claims data included submissions between July 1, 2021, and June 30, 2022, from the practice’s area locations. The raw data output was exported into an Excel format and included individual claims for each patient encounter. Specific data categories queried included the date of service, the month of service, place of service, original payer and benefit plan name, CPT code(s), description of service(s), diagnosis codes, wRVUs, payment success, and reason for claim denial.
A second electronic medical record data query of the practice’s appointment schedules was performed, collecting “no-shows” and “completed” diabetes visits in the same time frame as the CCA. The data query specifically included visit type, clinical department and division, provider name, specialty, appointment date and time, and appointment status. It is important to note that the scheduling data output is different from the claims data output used for the first two study aims. The query searched for visit types of either “new diabetes” or “return diabetes,” and not by a specific diagnosis like the claims data. This search also included all insurance recipients, private and Medicaid. Due to the limitations of the software, private insurance cannot be excluded.
Direct costs such as basic clinic operations, the cost of telehealth platforms, physician salaries, or other intangible costs were not collected and did not factor into the analysis.
Results
The billing data retrieval for the project analysis produced 1089 submitted Medicaid claims. As a result of data cleaning, 44 claims were not included in the analysis: 28 were out-of-state claims, 9 were inpatient hospital claims, and 7 were claims for a different diagnosis other than diabetes. Data were color-coded based on their place of service codes to represent 2 categories: 110 telehealth claims and 935 in-clinic claims. The records do not represent the number of visits but rather the number of claims, and there may be multiple claims per patient encounter or visit. For both categories, claims were sorted according to CPT code descriptions indicating the length of time and complexity of the patient’s care. For example, CPT code 99245 is a claim code used when a qualifying provider sees a new or established patient in-clinic for 55 minutes or for the highest level of medical complexity. Although there is some subjectivity to assigning levels of care complexity, there are standard criteria for providers to follow, and generally the provider’s documentation supports the decision. In the same example, the CPT code 99245 is labeled “HIGH MDM,” so for this analysis, it is understood that there was a high level of medical decision-making (MDM) for this claim. Once the CPT codes were sorted, 793 of the 935 (85%) in-clinic claims were for visits over 40–55 minutes, rated as a moderate to high level of MDM (Figure 2). The remaining breakdown of in-clinic claims included 139 claims coded for 30–39 minutes with moderate MDM and 3 visits with low MDM. There were no in-clinic claims submitted for less than 20 minutes. The 110 telehealth claims had more varied CPT code types, with 59% between 20–39 minutes and a low to moderate MDM. Of the telehealth claims, 15% were 40–45 minutes with a high MDM, and only 2 of the 110 claims were new patient evaluations (Figure 2 and Figure 3).

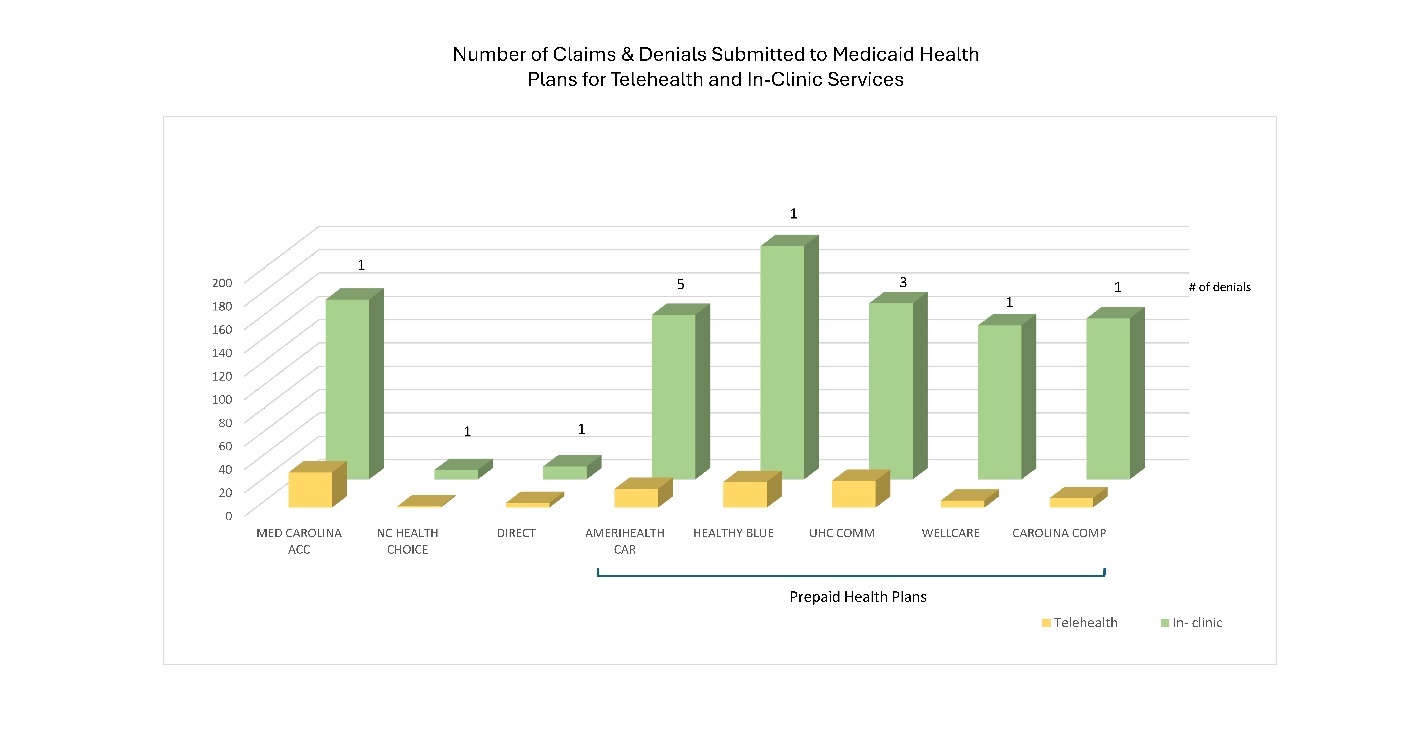
The results of the CCA are in Table 1. The primary project objective was to determine the denial rate for each delivery care pathway and if there was a high denial rate for any prepaid health plan under the new Medicaid managed care model. To determine denial rates, telehealth and in-clinic claims were sorted according to their claim status and summed according to paid or unpaid. One hundred percent of telehealth and 98.5% of in-clinic claims were paid in full during the stated fiscal year, which is a 0% and 1.5% denial rate, respectively. Fourteen total in-clinic claim denials were reported; five claims were submitted to AmeriHealth Caritas and denied for reasons not listed by the practices’ billing departments. The UnitedHealthcare Community Plan had 3 denials due to enrollment delay. All Medicaid health plans, including those that will phase out due to the ongoing transformation, had at least 1 denial (Figure 3).
The workload for the study was assessed using the wRVUs reported with each claim. The mean wRVU for in-clinic was 2.71 (n = 935, SD = 0.370, 95% CI 2.683–2.731) and was 1.81 for telehealth (n = 110, SD = 0.602, 95% CI 1.95–1.920). Of the 935 in-clinic claims, the mean wRVU was 2.76 for type 1 diabetes (n = 478, SD = 0.269, 95% CI 2.733–2.781) and 2.69 for type 2 diabetes (n = 241, SD = 0.416, 95% CI 2.633–2.78). Of the 110 telehealth claims, the mean wRVU for type 1 diabetes was 1.80 (n = 80, SD = 0.561, 95% CI 1.678–1.923) and 1.99 (n = 7, SD = 0.709, 95% CI. 1.473–2.523) for type 2 diabetes.
The query collecting the completed visits and no-show data set was obtained with the assistance of the data access manager within the health care practice. In total, 4941 diabetes visits occurred from July 1, 2021, to June 30, 2022; 3794 were in-clinic and 1147 were telehealth. Of the in-clinic visits, 2015 were completed successfully and 584 (22.5%) were no-shows. Patients completed 786 telehealth visits during the same time frame, and 117 (13.0%) were identified as no-shows. The remaining visits were cancellations and were not considered in the analysis. A mean of 48.67 in-clinic no-shows per month (n = 584, SD = 6.527, 95% CI 48.137–49.196) was higher than the mean telehealth no-shows per month of 9.75 (n = 117, SD = 5.642, 95% CI 8.728–10.772). A Fisher’s Exact test showed a statistically significant difference in the mean of both visit types (P = .000). Unfortunately, when evaluating the rates of no-show encounters, patients using Medicaid benefits could not be extracted. The data include both private medical insurance holders and Medicaid beneficiaries. However, the data remain reliable for the CCA because the data show the difference in no-show rates between telehealth and in-clinic visits among diabetes patients.
Discussion
CCA Analysis Findings
The cost-consequence analysis helps visualize how a practice’s care delivery strategy impacts patient health and financial outcomes. A 0% denial rate for telehealth claims is an unexpected and positive finding. However, the power of the CCA does more for financial decision-making in a health care environment than looking at statistics. Instead, consideration is given to the interactions between costs, revenues, and patient-centered outcomes. Studying the CCA chart (Table 1), it is clear there is a higher cost for the complexity of work entailed for visits conducted in the clinic and a small but additional loss of revenue due to denials. In conjunction with lower no-show rates, these existing costs support the continued growth of the telemedicine practice. Indeed, the practice cannot solely utilize telehealth, but there are clear benefits for the patients and the practice to move away from the traditional in-clinic visit volume. For this practice, a small fraction of claims and revenue results from telehealth visits, so there is room to develop a more substantial telehealth model. Post-pandemic, the state Medicaid program reimburses telehealth visits the same as an in-clinic visit, strengthening the argument that the practice must consider shifting more of its patient care delivery to telehealth. Theoretically, a well-adopted telehealth model would increase contact between the diabetes team and patients, thereby decreasing no-shows compared to traditional in-clinic visits. The telehealth reimbursement rates may be less because the average visit is less complex and therefore generates lower wRVUs. However, a higher frequency of telehealth visits can sustain the practice’s revenue while having a positive patient outcome.
Lastly, the flexibility of the CCA makes it attractive for quick analysis and decision-making, especially when considering implementing a new program like telehealth. This CCA focused on more variable costs impacting this practice’s telehealth program. Excluding fixed costs like overhead for telehealth communication equipment could be a misstep and may fall short of giving a complete financial picture. Another valuable lesson learned during the project analysis was choosing a health outcome(s) that can be accurately measured and easy to collect. If the data cannot be easily queried or sorted, then the process becomes cumbersome. For this study, the patient-specific outcome, the difference in no-show rates, was validated using a statistical test of significance called the Fisher Exact test due to the categorical nature of the data. It ruled out any nonrandom associations and confirmed that there were higher no-show rates for patients seen in the clinic. Due to the limitations of our query in the EPIC platform, the low telehealth no-show rates represent all the patients in the practice and were not specific to patients using Medicaid.
Telehealth Reimbursement Under Medicaid
The denial rates were lower than anticipated under the new NC Medicaid managed care system. However, there was a significant difference in denials between Amerihealth and the other plans (P = .029), accounting for 35.7% of the total in-clinic denials, although the numeric value was still very low (n = 14). The practice’s internal system for flagging billing errors and inconsistencies provides some insight. This practice has multiple layers of internal checks for identifying errors, including software programs and designated staff. This becomes increasingly important as practices consider ramping up their telehealth programs during the state’s Medicaid system transition to a value-based payer system. In a value-based payer system, quality metrics determine the reimbursement amount for a health care practice or provider, prioritizing quality care and prevention. Some metrics are self-reported through provider documentation and coding, while NCDHHS monitors others. Proper bill coding and documentation become increasingly critical for a practice to do well in this VBP system, and adequate resources must be budgeted for claim submissions to be successful.
Other Considerations
The number of no-shows for the outpatient pediatric office we studied were substantial, with a monthly mean of 48.66 (CI = 48.137–49.167) and a rate of 22.0% for in-clinic visits. Telehealth had a significantly lower monthly mean of 9.75 (CI = 8.728–10.772) visits and a rate of 12.9%. We were not able to develop a query to determine how many patients had repetitive no-shows, a metric that would have been valuable to analyze for the CCA. In the analysis, the number of cancellations were not included with the no-shows, as it would have inflated the number of total missed appointments without accounting for the patients who rescheduled several times. Furthermore, due to the limitations of the query, the third study objective could not be answered accurately since the difference in no-show rates was analyzed for all of the practice’s patients with diabetes and not just Medicaid beneficiaries. Regardless, it was found that significantly more children attended their telehealth visits, proving that the clinic’s telehealth methodology was in fact working. Since the literature indicates that a patient’s HbA1c significantly improves when they see their health care team more frequently (usually a combo of in-clinic and telehealth), it is in the best interest for this practice and its patients to continue expanding their telehealth capabilities.14
The mean wRVUs for telehealth (1.81) had a 95% confidence interval of 1.70 to 1.92, a wider range than the in-clinic wRVUs. The margin of error continued to rise when analyzing the means for type 1 and type 2 DM due to a small sample size with more variation. Higher wRVUs were expected with longer, more comprehensive in-clinic visits. However, telehealth wRVUs were still relatively high because, in some instances, providers saw established patients for complex care via telehealth. This is a focal point for the diabetes team when modifying their telehealth strategy moving forward. Increasing telehealth visits that code as moderate to high MDM (99244/45, 99214/15) could financially strengthen a telehealth program and support patients who may be starting to decompensate and cannot come to the clinic immediately. The team would need to determine when these types of visits are appropriate and the appropriate coding. Now that most practices have adopted telehealth models into their daily workflow, developing a program with patient safety first, along with financial performance, is critical.
Examining Cost Variables
As a final step, the profit margins for both diabetes care delivery pathways were examined. The net difference in no-show rates appeared favorable for telehealth visits, as they had 9.1% less no-shows than in-clinic visits. It is fully expected that RVU compensation profits will be higher for the totality of in-clinic visits in the analysis. However, the in-clinic visit revenue had to account for more lost profits due to claim denials and a higher rate of no-shows.
Limitations
A CCA is a quick, comprehensive financial tool that compares costs to health and non-health outcomes. From a financial analytics point of view, it lacks cost-effectiveness thresholds and gives way to understating or overstating costs and outcomes if not careful. It is more empirical than methodological, not having a built-in study design seen in randomized-control trials.
The analysis had one outcome to compare: the no-show rate difference between the two delivery care pathways. The analysis would be more substantial with additional measurable outcome data, such as patient complexity at baseline, or patient hospitalizations for diabetes-related events, such as diabetic ketoacidosis or hypoglycemia. In this study, using quality metric(s) that are of interest to the PHPs and NCDHHS is undoubtedly desirable. Additionally, expanding the CCA to include more in-depth expenses associated with telehealth implementation would make the analysis richer. Telehealth expenses could include, but not be limited to, technical support, software upgrades, and non-physician staff salaries, among other expenses. The data is still relevant for practices, as it demonstrates relative differences in telehealth and in-clinic completion rates for children in North Carolina.
It is important to note that although the data were evaluating a timeframe between 2021 and 2022, many patients were still navigating the effects of the pandemic and may differ in vaccination status. There may have been a difference in patients who chose to seek telemedicine care compared to those who were evaluated in the clinic setting.
Finally, the CCA included the no-show rates for all patients, both Medicaid and privately- insured. Unfortunately, the data could not be parsed to reflect only Medicaid patients.
Conclusion
Managing a patient’s diabetes is challenging, requiring consistent contact with their diabetes team to achieve optimal outcomes. The nuances of pediatric diabetes management include providing care to a growing and developing child, changing family dynamics, and financial barriers. The American Academy of Pediatrics (AAP) recommends telehealth as a viable option to promote more consistent and accessible care for patients, particularly those with lower socioeconomic status who are at risk for less optimal outcomes.15 Telehealth, for the practice we studied, demonstrated an upstream solution for pediatric patients with diabetes, who are among the most vulnerable in the Medicaid system. Considering several cost variables in the CCA, telehealth is a sustainable method for improving these children’s health outcomes under the new NC Medicaid system. Performing a CCA made it more evident that the practice had not completely integrated with a telehealth model and that it would be feasible to do so. However, using other possible cost variables and health outcomes could give the practice a deeper understanding of their economic position regarding telehealth, since the health outcome data in this analysis had limitations. A CCA is underutilized in today’s health care system but is helpful in developing cost-effective delivery care models that are so critical for improving patients’ health outcomes, reducing expenses related to disease management, and ensuring the financial health of medical practices supporting these patients.
Disclosure of interests
The authors have no disclosures related to this manuscript.