
Introduction
As part of the Health in All Policies approach, the public health community in the United States has been acutely focused on evidence-based decision-making, integrating data on community preferences and unmet needs into targeted interventions to improve population health.1–3 The cornerstone of implementing evidence-based public health involves performing community assessments, prioritizing needs, developing responsive interventions, and evaluating the process, impact, and outcomes of these planned interventions.4–6 A provision outlined in the Affordable Care Act (ACA) under Internal Revenue Service (IRS) §501(r) regulations (i.e., the Community Benefit Rule) requires that all non-profit hospitals collaborate with local public health agencies and community organizations to perform a community health needs assessment (CHNA) every 3 years. However, few models exist to aid local health departments and hospital systems in establishing these partnerships using a coordinated process for soliciting input from health leaders and community residents.
Social determinants of health (SDoH), also referred to as intermediate determinants of population health, are the social factors influencing individual and community health.7–9 A primary goal of the CHNA is to understand the impact of SDoH—the conditions in which individuals are born, develop, live, and work that are largely beyond individual control10—and to identify and prioritize community health needs. Despite the increasing use of data from CHNAs, an analysis of 10 exemplary CHNAs found that only 2 out of 10 included a community survey on a representative sample of community residents.11 Additionally, CHNAs are typically conducted for individual counties and are compared to state or national trends rather than “peer” counties with similar health profiles, limiting the ability of local hospitals and health departments to benchmark results effectively.
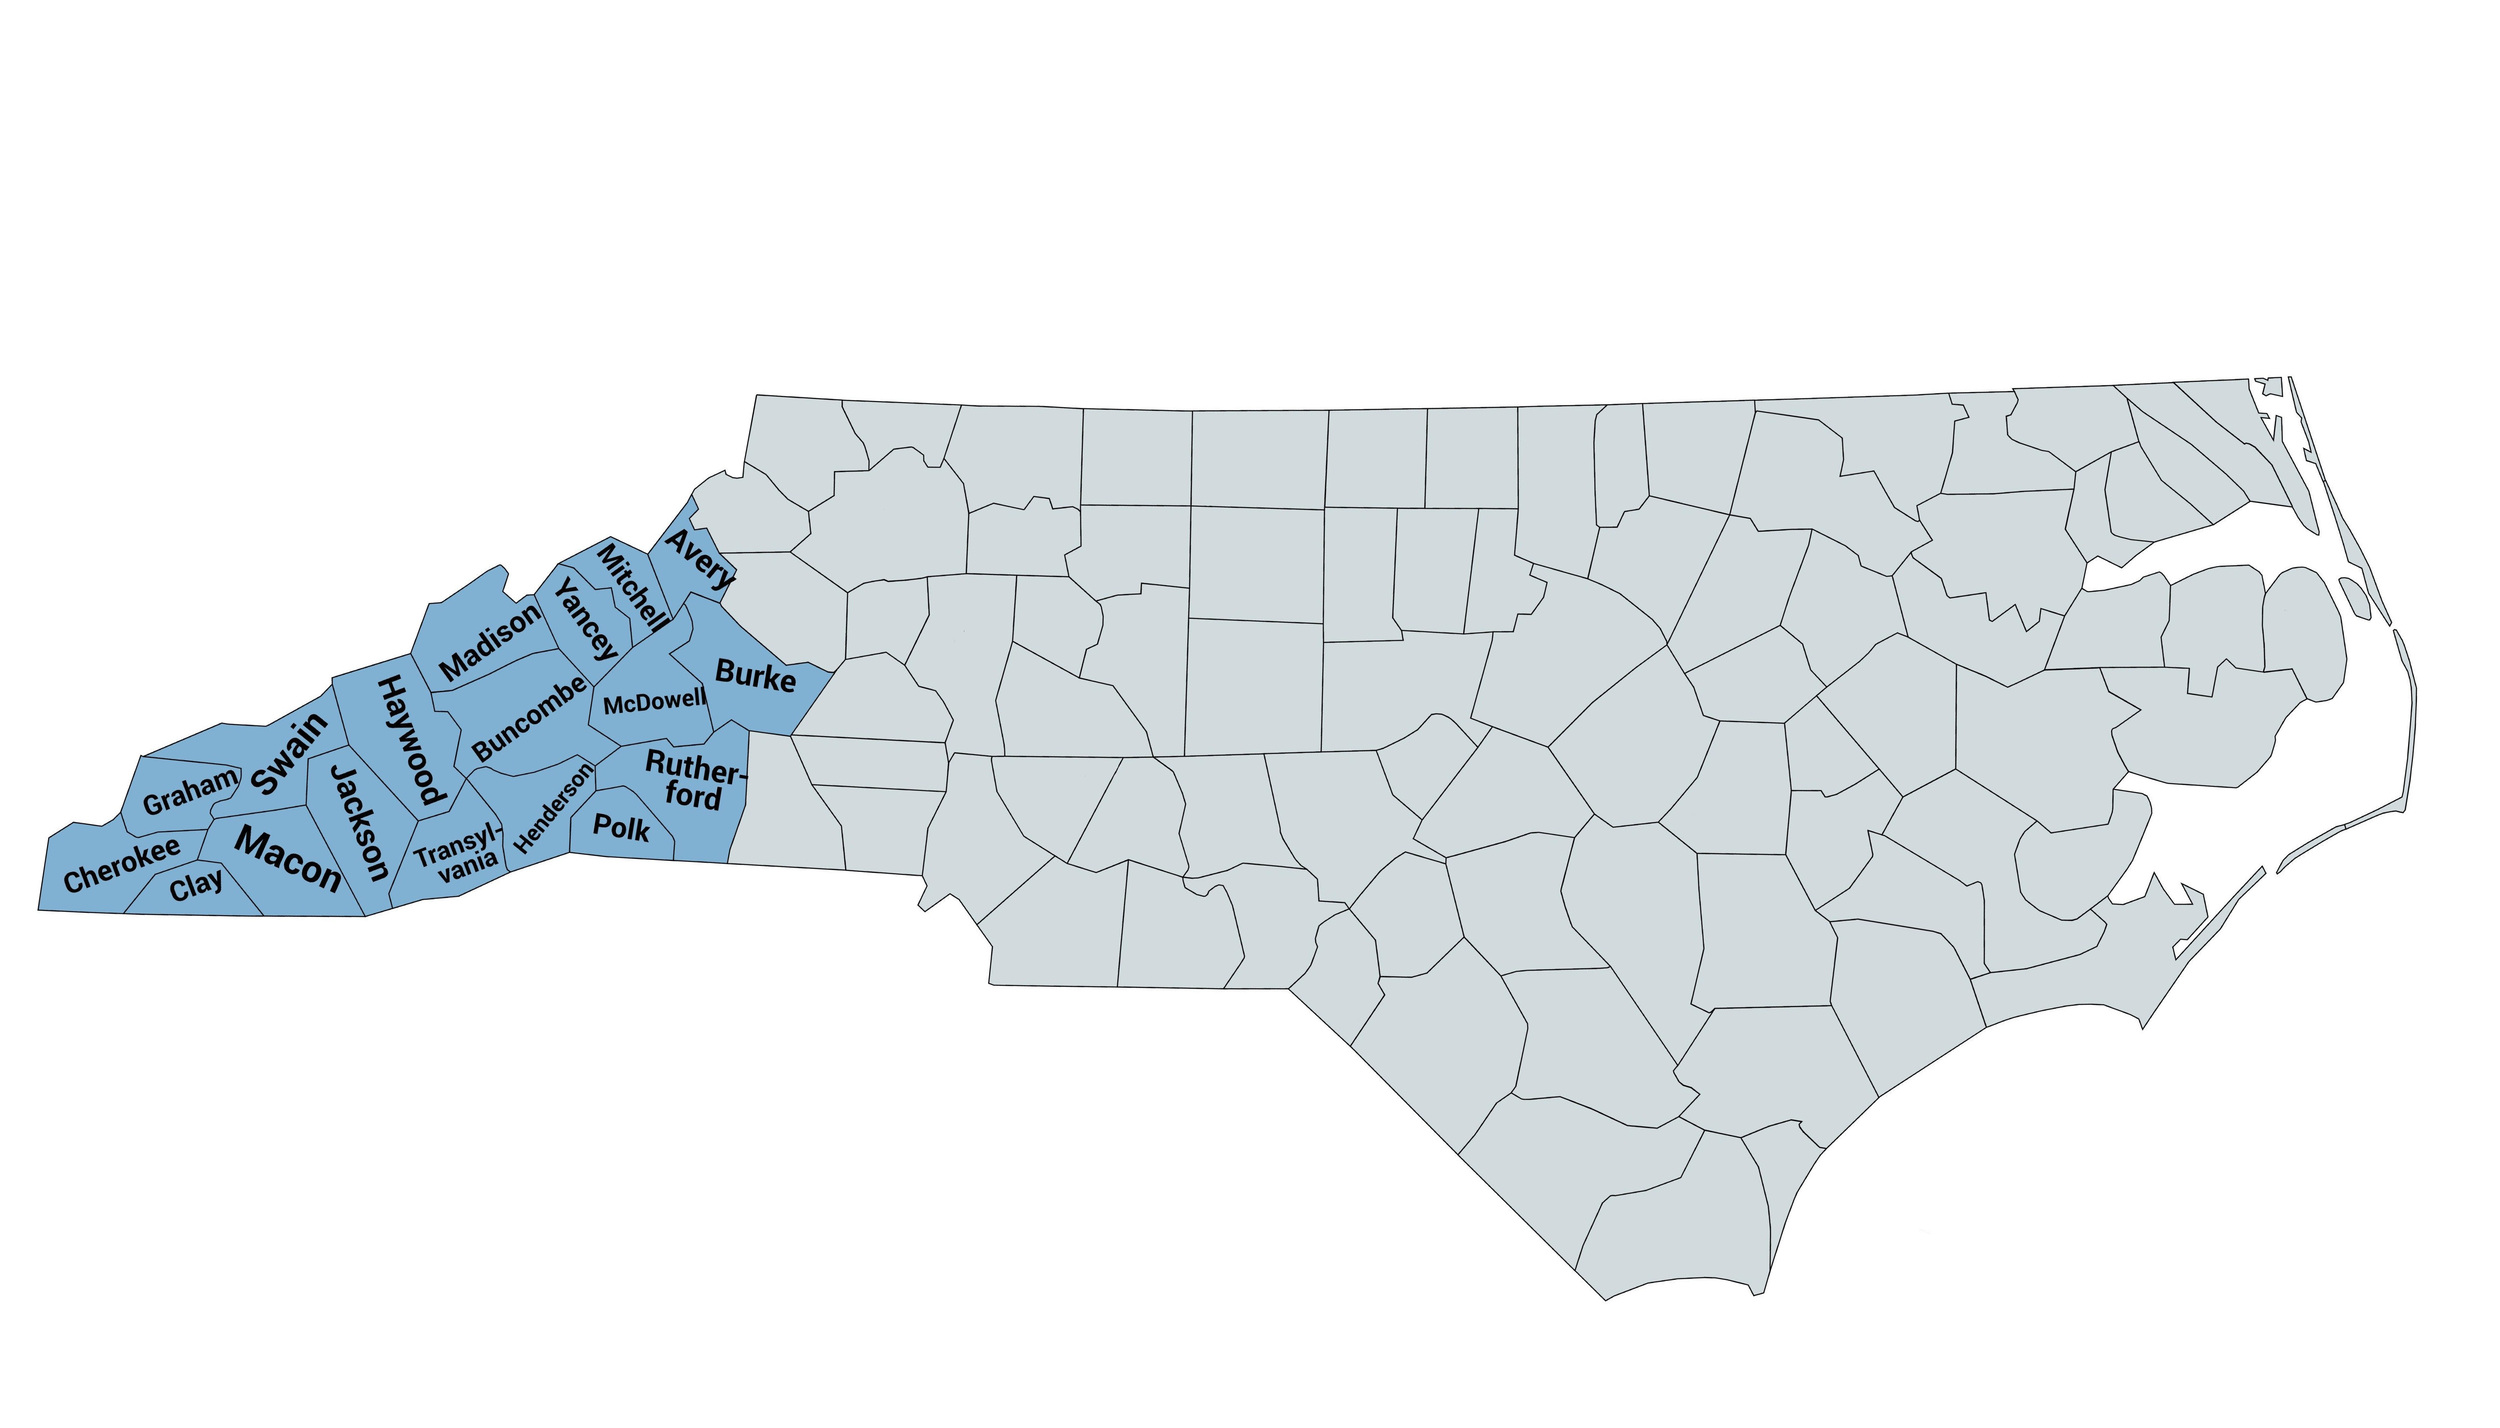
One important gap involves the role of the CHNA in addressing health inequalities in rural communities. In Western North Carolina, a predominantly rural region, health leaders from local hospitals and health departments are collaborating to establish a regional model for community health improvement (CHI). In 2011, following the ACA’s implementation, WNC Health Network—originally an alliance of hospitals in 16 Western North Carolina counties—partnered with health department directors to form WNC Healthy Impact.12 WNC Health later expanded to a non-profit organization focused on community health improvement across an 18-county region in 2021. This partnership implemented a triennial CHI process cycle, aligning efforts across the region to co-design data collection and processes on local health needs and to integrate results into regional hospital and public health department planning, evaluation, engagement, and community health action.13 Appendix A details the 2023 estimated populations of the 18 Western North Carolina counties, as reported by the American Community Survey.14 This study examines data from 5 completed CHNA surveys (2012, 2015, 2018, 2021, and 2024) in Southern Appalachia to explore the association between self-reported health outcomes and selected SDoH, with a focus on race and poverty as drivers in regional inequality.
Methods
WNC Health Network and Health Impact Assessment
Every 3 years, in collaboration with WNC Healthy Impact, WNC Health Network compiles a regional dataset to describe health challenges and opportunities across 18 Western North Carolina counties (Appendix B). The regional CHA (Community Health Assessment) process began in 2012, aiming to reflect the overall health of the region with a focus on identifying priority health concerns. The WNC Community Health Survey (formerly known as the WNC CHNA Survey) collects primary data to supplement the core dataset, enabling counties to address specific concerns, and is conducted every 3 years to align with the region’s CHNA cycle and meet hospital and health department requirements.
Regional Community Health Survey
To date, 5 cross-sectional waves of complex survey data (2012, 2015, 2018, 2021, 2024) have been collected in partnership with PRC, a market research and consulting company specializing in high-quality survey research, following a methodology similar to the Centers for Disease Control and Prevention (CDC)'s Behavioral Risk Factor Surveillance System (BRFSS) survey. A total of 3300 to 5000 telephone interviews were conducted each year with adult residents, stratified by county of residence. This sampling approach provided aggregate results with a maximum error rate of +/- 1.3% at the 95% confidence interval.15 Post-stratification weighting was applied to adjust for unequal probabilities of participant selection, non-response, and other population factors, ensuring the survey results are generalizable to the target population.16–18
Health Outcomes
The primary self-reported health outcomes included in our analysis were categorized as binary (yes/no) variables: asthma, cardiovascular disease (CVD), chronic obstructive pulmonary disease (COPD) (diagnosed with chronic lung disease such as COPD, bronchitis, or emphysema), diabetes, prediabetes, obesity (BMI ≥ 30), high cholesterol, high blood pressure (HBP), and poor mental health (measured as experiencing more than 7 days of “not good” mental health within the past 30 days).
Social Determinants of Health
To understand social patterning in health disparities, our work focused on the following select SDoH: self-reported race/ethnicity, self-identified as non-Hispanic white, non-Hispanic Black/African American, Hispanic, American Indian/Alaska Native, Mixed-race, and Other-race (i.e., Asian, Native Hawaiian/Pacific Islander, Middle Eastern), and income. Income was categorized into quartiles—lowest, low, middle, and high—within each survey year to reflect relative income distribution. Because quartile thresholds were based on the distribution of responses within each wave, the income range varied slightly across years to account for inflation and regional economic shifts (Appendix C).
Potential Covariates
Prior studies have identified age as a significant predictor of self-reported physical health,15,19 and have consistently documented important gender differences in physical health conditions.20–26 In the United States, rural populations experience a higher prevalence of chronic health conditions.27–30 Based on this evidence, we included the following variables as potential covariates: age (18–34, 35–54, 55–64, ≥ 65), sex (male/female), education (less than high school, high school graduate, some college, college graduate, postgraduate degree), insurance (yes, no), and urbanity (urban versus rural).
Statistical analysis
Data from each survey year were concatenated. Variables were harmonized across survey waves to ensure consistency in coding and interpretation. Respondent-level survey weights were retained. All analyses accounted for the complex survey design and used post-stratification weights based on county-level demographic characteristics, including gender, age, race/ethnicity, and poverty status to improve representativeness of the sample. Survey weighting procedures were modeled after the CDC’s BRFSS methodology.18 Survey-adjusted univariate and means analyses were used to calculate population demographics by reporting weighted proportion prevalence. Separate multivariate survey logistic regression models were performed to examine the influence of race/ethnicity and poverty. To assess potential effect modification, an interaction term between race/ethnicity and income quartile (race_ethnicity × income_quartile) was included in the models. In models assessing race/ethnicity, income was included as a covariate, while in models assessing income, race/ethnicity was adjusted for. All models controlled for age, sex, educational attainment, and urbanity. Adjusted and unadjusted odds ratios with 95% confidence intervals were reported. Pooled data (2012–2024) were used for each outcome, except for asthma, CVD, and COPD, which were analyzed from 2015 onward. All analyses were performed in SAS v9.4, employing procedures such as PROC SURVEYFREQ and PROC SURVEYLOGISTIC to account for the complex survey design and incorporate sampling weights.31
This study was assigned Exempt status by the North Carolina State University Institutional Review Board (protocol #22314).
Results
Table 1 summarizes the demographic characteristics of the 15,524 respondents, representing regional population demographics. The Western North Carolina region has a disproportionately high uninsured population (15.0%), which is nearly double the national average (8.3%)32 and higher than the North Carolina statewide average of 11.0%.33 Uninsured residents were more likely to report preventable conditions such as diabetes, high cholesterol, HBP, and asthma. Educational attainment was also a key factor, with 60.4% of residents having less than a college degree, a pattern associated with poorer health outcomes such as CVD, COPD, diabetes, and obesity. Unemployment in Western North Carolina (5.1%) was slightly higher than the 2021 statewide and national averages, which are both reported at 4.9%,34,35 and 9.9% of residents reported being unable to work.
Table 2 presents the weighted prevalences of chronic conditions of interest across survey waves, while Tables 3 and 4 detail crude and adjusted odds ratios for health outcomes by racial/ethnic groups and income quantiles, respectively.
.jpg)
Asthma
Asthma prevalence in Western North Carolina (17.4%) was double the state average (8.7%).36 We observed a dose-response relationship between income inequality and asthma: compared to high-income residents, low-income residents had 32% higher odds (95% confidence interval [CI]: 1.05, 1.66), while lowest-income residents had 78% higher odds of reporting asthma (adjusted odds ratio [aOR]: 1.78; 95% CI: 1.49, 2.12). American Indian/Alaska Native residents had over twice the odds of reporting asthma compared to White residents (aOR: 2.04; 95% CI: 1.32, 3.16).
Cardiovascular Disease (CVD) and Associated Risk Factors
The prevalence of CVD in Western North Carolina (7.5%) was slightly lower than the state average (9.8%).37 However, lowest-income residents had twice the odds of CVD compared to high-income residents (aOR: 2.12; 95% CI: 1.42, 3.15). HBP in Western North Carolina (39.8%) exceeded the state’s overall prevalence (34.7%),38 while high cholesterol (34.0%) was lower than the state average (36.8%).39 Black residents had 84% higher odds of HBP than White residents (95% CI: 1.45, 2.34). Lowest-income residents had 33% higher odds of HBP (aOR: 1.33; 95% CI: 1.03, 1.58) and 13% higher odds of high cholesterol (aOR: 1.13; 95% CI: 1.03, 1.25) compared to high-income earners.
Chronic Obstructive Pulmonary Disease (COPD)
COPD affected 12.3% of Western North Carolina residents. Compared to the high-income group, lowest-income residents had 2.46 times the odds (95% CI: 1.99, 3.04) and low-income residents had 1.62 times the odds (95% CI: 1.27, 2.06) of reporting COPD. Hispanic residents had significantly lower odds of COPD than White residents (aOR: 0.31; 95% CI: 0.13, 0.75).
Diabetes and Prediabetes
Diabetes prevalence in Western North Carolina was 13.4%, which is slightly higher than the state’s 12.7%.40 Black residents had 44% higher odds of reporting diabetes (aOR: 1.44; 95% CI: 1.19, 1.74) and American Indian/Alaska Native residents had 2.62 times the odds (95% CI: 1.34, 5.10) compared to White residents. Income disparities persisted, with low-income residents having 54% higher odds (95% CI: 1.36, 1.76) and lowest-income residents having over twice the odds (aOR: 2.21; 95 % CI: 1.94, 2.49) of diabetes compared to high-income earners. Prediabetes affected 11.6% of Western North Carolina residents, with lowest-income residents having 1.57 times the odds of reporting prediabetes compared to high-income residents (95% CI: 1.32, 1.86). Those in the Other-race group had nearly 2.5 times the odds of prediabetes compared to White residents (aOR: 2.42; 95% CI: 1.02, 5.74).
Obesity
In total, 32.9% of Western North Carolina residents reported obesity, which is slightly lower than the statewide average (34.0%).41 American Indian/Alaska Native residents had 64% higher odds of obesity compared to White residents (aOR: 1.64; 95% CI: 1.13, 2.37). The low-income group had 23% higher odds of obesity (aOR: 1.23; 95% CI: 1.03, 1.48), and lowest-income residents had 25% higher odds (95% CI: 1.11, 1.41) compared to their high-income counterparts.
Poor Mental Health
Poor mental health affected 18.2% of Western North Carolina residents, with weighted prevalence rates highest among the lowest-income (28.3%) as compared to low-income (19.4%), middle-income (13.7%), and high-income residents (10.2%). Low-income residents had nearly twice the odds of poor mental health (aOR: 1.97; 95% CI: 1.37, 2.84), while lowest-income residents had over 3 times the odds compared to high-income residents (aOR: 3.32; 95% CI: 2.54, 4.33). Mixed-race residents had 28% higher odds of reporting poor mental health (95% CI: 1.00, 1.63), while Hispanic residents had 73% lower odds compared to their White counterparts (aOR: 0.27; 95% CI: 0.11, 0.66). Compared to the statewide BRFSS-reported average of 3.9 poor mental health days in the past 30 days,42 Western North Carolina residents experience a higher average of 4.5 days.
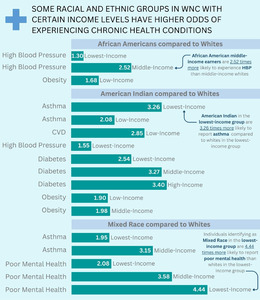
Intersection of Race and Poverty
Results showed that higher income did not eliminate racial disparities in health outcomes (Figure 1). Among lowest-income individuals, Black residents had twice the odds of HBP compared to White lowest-income counterparts (aOR: 2.08; 95% CI: 1.65, 2.62), a disparity that increased in higher income groups (middle-income: aOR: 2.70; 95% CI: 1.79, 4.06). Additionally, Black high-income residents had 86% higher odds of obesity compared to White residents in the same income bracket (aOR: 1.86; 95% CI: 1.45, 2.39).

Similar disparities were identified across other racial groups. American Indian/Alaska Native residents in the lowest-income group had over 5 times the odds of reporting asthma (aOR: 5.15; 95% CI: 3.44, 7.64) and over 4.5 times the odds of reporting CVD (aOR: 4.64; 95% CI: 3.11, 6.93) compared to their White lowest-income counterparts. Mixed-race middle-income residents had over 4.5 times the odds of poor mental health compared to middle-income White residents (aOR: 4.64; 95% CI: 2.48, 8.67), while Mixed-race residents in the low-income group had more than 4 times the odds (aOR: 4.18; 95% CI: 2.72, 6.43) of experiencing poor mental health compared to their White counterparts in the lowest-income group. Lowest-income Mixed-race individuals also had over 3 times the odds of reporting CVD compared to White lowest-income earners (aOR: 3.33; 95% CI: 1.64, 6.73).
Discussion
Findings highlight persistent income and racial/ethnic disparities in health outcomes in the rural Southern Appalachian region of Western North Carolina. About 25% of Western North Carolina residents fall into the lowest-income bracket and face significantly higher health risks, including more than double the odds of diabetes, COPD, and CVD, and more than 3 times the odds of poor mental health compared to high-income residents. These patterns highlight a critical need for interventions that address the structural determinants of health in this region. Importantly, higher income did not eliminate racial disparities.
Consistent with prior research showing that income gains yield fewer health benefits for Black residents than for White individuals,43 both race and poverty independently contributed to health inequalities in the region.44–47 Notably, Black, American Indian/Alaska Native, and Mixed-race residents, regardless of income level, experienced significantly higher odds of chronic conditions, including asthma, obesity, and diabetes. These findings underscore the need for participatory and qualitative research to contextualize these disparities through lived experiences and to co-develop targeted strategies that address the underlying structural and social determinants of health, particularly in underrepresented communities of color.
CHNAs are a vital tool for identifying and addressing structural barriers and systemic issues that affect health, particularly in rural settings. They help uncover critical issues such as limited access to health care, medication affordability, housing instability, transportation difficulties, and educational or employment disparities. CHNA data can drive policy and systematic change by informing local efforts to expand public transportation, invest in community health worker (CHW) programs, and provide mobile health services. CHWs are particularly effective in rural communities, where they serve as trusted faces and understand local culture and resources.48–50 CHNAs also guide resource allocation to high-risk areas, establish baselines for monitoring progress, and support collaboration among health care providers, community organizations, policymakers, and residents. This ensures culturally relevant interventions that drive meaningful, lasting change.
Structural and institutional barriers exacerbate health disparities, especially in rural Southern US communities.51 These systemic factors limit access to quality health care, preventive services, and timely treatment.52 In many rural communities, provider shortages, hospital closures, and increased travel burdens disproportionately impact Black and Hispanic residents.53 Provider bias and discrimination, implicitly or unconsciously, further widen disparities, contributing to delays in diagnosis, under-treatment of pain, and inadequate management of chronic conditions, particularly for rural low-income or non-White communities.54,55 Economic instability further exacerbates these patterns, limiting access to health insurance, nutritious food, safe housing, and other essential resources.56–59 Economic instability and unsafe living conditions can elevate stress levels, worsening existing chronic health risks.60
The cumulative effects of systemic racism and economic marginalization are particularly harmful to Black and American Indian/Alaska Native adults in the rural South.52,61 Structural barriers to education and employment perpetuate these inequalities, as lower educational attainment often correlates with lower income levels and limited health care access.52 While many of these factors are reflected in the CHNA, incorporating additional dimensions such as sexual orientation, gender identity, and nativity could provide a more nuanced and comprehensive understanding of the lived experiences in rural communities.61 This broader framing is essential for developing equitable and effective public health responses.
Strengths and Limitations
To ensure data representativeness of the target Western North Carolina population, this study employed stratified random sampling and post-stratification weighting to achieve adequate representation across race/ethnicity, gender, age, and income groups. Post-stratification adjustments accounted for unequal selection probabilities, non-response, and other population-level factors that might influence response patterns.16–18
This study has limitations. Small sample sizes for racial/ethnic groups and missing income data constrained analyses, as only complete cases with full income and health outcome data were included. Although combining 5 cross-sectional survey waves increased power, the design precluded assessing longitudinal trends in poverty and racial disparities, particularly given the limited representation of non-White populations across survey waves. However, findings on other SDoHs, such as education and employment, consistently showed poor health outcomes with narrow confidence intervals.
While this study highlights the value of representative, population-based survey data in understanding rural health needs, we recognize that replicating this approach may not be feasible for all communities. We provide a model from a predominantly rural and financially constrained region of Western North Carolina to demonstrate how such a process can be done. However, we acknowledge that this effort reflects over a decade of relationship-building, regional collaboration, and infrastructure development. The ability to implement a large-scale, representative Community Health Needs Assessment survey relied heavily on strong local partnerships—including between hospitals, public health agencies, and regional health networks—which helped to overcome significant budgetary, staffing, and technical barriers. As such, this model may not be immediately replicable in regions lacking these types of cross-sector collaborations or resource-sharing mechanisms. Future efforts to strengthen the utility of CHNA data for rural health planning will likely require broader investments in public health capacity and long-term support for local and regional partnership development.
Future Directions
SDoH are distinct from the structural determinants that operate upstream of health disparities.7 Research is needed on the mechanistic pathways through which behaviors and psychosocial factors mediate or moderate the relationship between income, race, and rural health. Our results demonstrate significant racial disparities, underscoring the need to study everyday discrimination as a key driver of health disparities. Racism and discrimination shape health outcomes,62,63 and multiple mediation approaches can clarify how these pathways—interacting with factors like inadequate health care, food insecurity, and affordable housing—contribute to disparities.
Conclusion
This analysis examined SDoH to understand health disparities in rural Western North Carolina. Key findings revealed persistent income and racial disparities, with Black residents, regardless of income, facing higher odds of asthma and diabetes. American Indian/Alaska Native had higher odds of asthma, diabetes, and obesity, while Mixed-race residents had higher odds of asthma and poor mental health. Lowest-income residents experienced disproportionately higher odds of all chronic conditions of interest. These patterns highlight the critical need for more participatory research and community-driven interventions. Community Health Needs Assessments (CHNAs) are essential tools for addressing rural health disparities. Applying a racial equity lens to CHNA data can help identify root causes, such as racism and income inequality, ultimately informing more effective and equitable health solutions.
Financial support
This study was supported in part by grants from the National Institutes of Health (NIH)'s National Institute of Environmental Health Sciences (NIEHS) (1R21ES035968-01A1). The NIH had no role in the design or conduct of the study; data analysis or interpretation; preparation, review, or approval of the manuscript; or decision to submit the manuscript for publication.
Disclosure of interests
The authors declare that they have no conflicts of interest or disclosures to report.