Introduction: The Challenge of a Healthier North Carolina is a Local One
As North Carolina’s public health community reaches the halfway point of the Healthy North Carolina (HNC) 2030 initiative, we arrive at a milestone for reflection and realignment. The statewide goals set forth in the foundational “Healthy North Carolina 2030” report1 provide an essential benchmark for collective progress towards population health and equity. However, North Carolina’s vast demographic and geographic diversity means that progress cannot be measured by statewide averages alone; we risk missing the granularity necessary to address the inequities that persist block by block. To flourish as an average is a hollow victory if our individual communities are struggling.
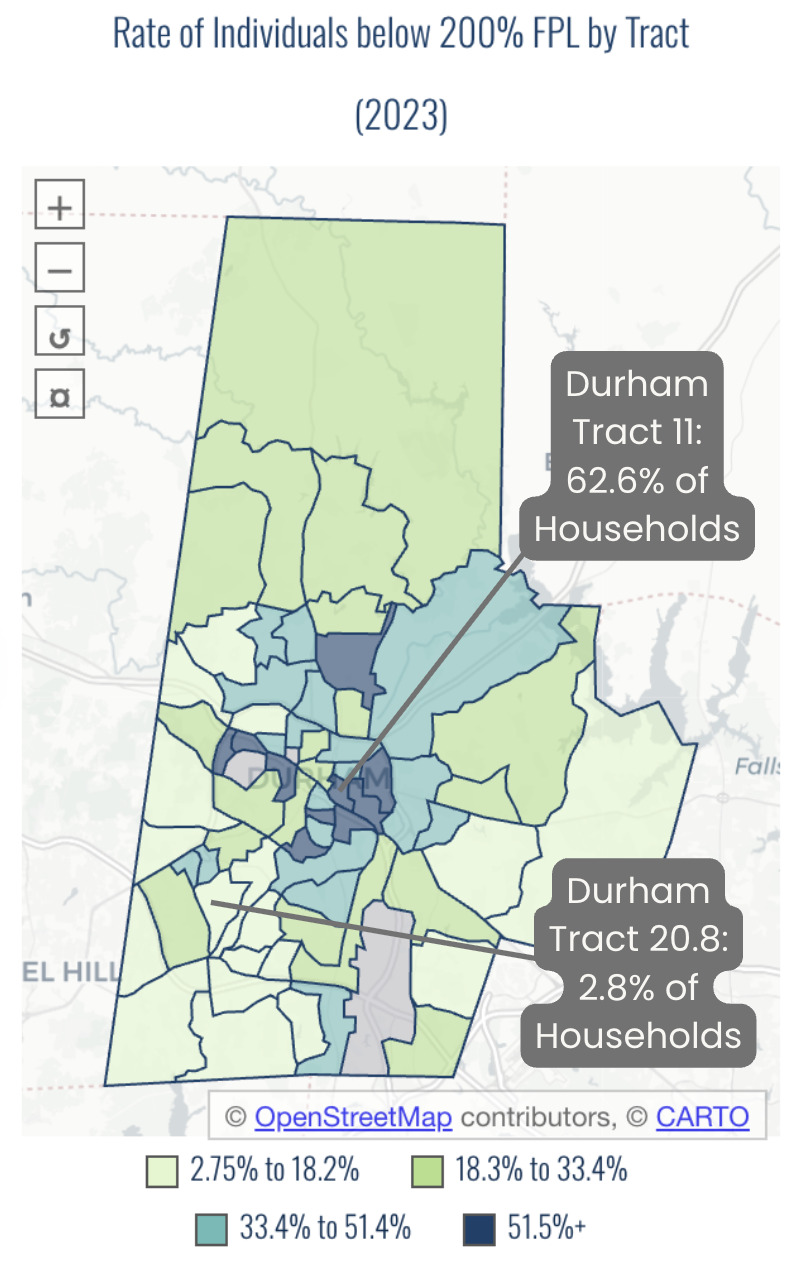
This challenge is not theoretical. In my own community of Durham, a county-level statistic masks lived realities. In some neighborhoods southeast of downtown, nearly 3 in 5 households live with an income below 200% of the federal poverty level. Just a few miles southwest, in the same county, that number plummets to 1 in 35 (Figure 1).2 This disparity is even starker along racial/ethnic lines; more than 1 in 5 Hispanic residents in Durham County lives in poverty (>20%), compared to only 6% of their non-Hispanic White neighbors.2 These are not gaps; they are chasms. Relying on a “one-size-fits-all” data approach is not only insufficient; it renders these chasms invisible, and in doing so, perpetuates them.

To truly “turn the curve” on our HNC 2030 indicators, we must empower the local leaders, practitioners, and advocates who work within these contexts. The democratization of granular data is the foundational catalyst for this empowerment. Typically, a non-profit director seeking data for a grant application faces a gauntlet: they must hope the right dataset exists publicly, that it is recent, that it is broken down by neighborhood and/or race, and that they have the technical capacity to analyze and visualize it. Data tools, however, can provide up-to-date, neighborhood-level, and disaggregated insights at peoples’ fingertips.
Our data work at Cape Fear Collective (CFC) was born directly from this paired challenge and opportunity. The organization formed our data team in response to a recurring set of frustrations voiced by our community partners: the struggle of partners to meet funder demands for data they couldn’t access, the constant requests for the same maps of food insecurity or housing instability, and the general inaccessibility of public information. To address these frustrations, we build and maintain data tools, provide technical assistance, and generate accessible, equity-focused analyses that put data in the hands of local leaders. This work fulfills CFC’s mission to cultivate data-driven solutions for a better North Carolina. It is guided by CFC’s core values of equity, collaboration, and community-centered impact, and represents our direct commitment to bridging the gap between the world of big data and the reality of on-the-ground community action.
Building the Toolbox for a Data-Driven State: The HealthyCommunitiesNC.org Dashboard
In response to both the need for granularity and the fragmentation of public health data, we developed the HealthyCommunitiesNC.org dashboard.3 The purpose of this tool is to translate data from dozens of siloed sources into a free, intuitive, and public-facing resource for leaders, practitioners, and advocates across all 100 counties and their legislative districts. To fully grasp the problem this tool solves, consider an analytical task: exploring the local relationship between school suspensions and incarceration rates. Without our dashboard, a researcher would have to navigate to a likely unfamiliar corner of the Department of Public Instruction’s website to find and manually download several separate annual reports about suspension. After cleaning and merging that data, they would then face the even more complex task of acquiring incarceration data, likely from the Department of Public Safety’s complicated manual-query webform, which would also require extensive cleaning and joining. The journey from question to insight would be a formidable technical challenge, accessible only to the most dedicated and skilled data sleuths.
The HealthyCommunitiesNC.org dashboard was designed to eliminate friction and to prioritize simplicity and accessibility. With a universe of potential metrics, the data team at CFC made a key strategic decision: to align the dashboard’s indicators directly with the HNC 2030 framework. The framework provided an evidence-based, state-aligned way to create a common language among stakeholders with a variety of needs. This approach also concentrated the immense, ongoing effort required for data maintenance into a single reliable tool. The tool serves as a shared resource warranting investment, rather than numerous organizations separately “reinventing the wheel” to build custom-made, yet duplicative dashboards. Finally, alignment with HNC 2030 allows users to track their community’s progress against the state’s official goals, fostering a sense of collective action and shared purpose.
The dashboard is not merely a website, but a piece of essential public infrastructure and a silent partner in community health improvement. As a free resource, HealthyCommunitiesNC.org provides universal access to clean, clear, and relevant data. Using the dashboard, our partners move beyond the foundational question of “What does it look like out there?” and on to the more important questions that follow, such as “Where should we target limited resources?” or “Which disparities demand urgent attention?”
Successes and Lessons Learned: Measuring the Impact of Data as a Silent Partner
The primary success of the HealthyCommunitiesNC.org dashboard is not only its existence, but its deep, organic adoption by our target stakeholders. Adoption manifests in myriad ways. We have heard directly from partners who used our localized data to help inform the placement of new bus stops. We regularly field requests from consultants drafting official Community Health Needs Assessments for county health departments who are seeking to download our datasets in bulk. We have seen our data cited by journalists telling compelling, evidence-based stories about the confluence of poverty, housing, and health disparities in our state’s communities. Each instance is a sign that the tool is actively being used to inform real-world decisions.
This anecdotal evidence is supported by quantitative backend analytics (Table 1). An average active time on-page of 2 to 3 minutes for county-level data,4 for example, indicates that users are not just glancing at the site by accident; they are engaged and exploring information. The Community Data Platform page is consistently the second-most visited on the site, suggesting strong demand for bulk datasets. Furthermore, referral traffic from domains including state agencies like the North Carolina Department of Health and Human Services (NCDHHS), county health departments, major hospital systems, and the North Carolina Institute of Medicine (NCIOM) (Table 2) confirms that the platform is reaching its intended audience and serves as a trusted resource. Together, these metrics tell a story of deep engagement from the right stakeholders.
Despite these successes, our most significant challenge has been confronting the inherent difficulty in tracking the dashboard’s impact. As is often the case with “silent partnership,” we have a limited view, one that excludes the specific offline actions the data informs. We have no inherent and systematic way of knowing what policy brief was strengthened, what community program was redesigned, or what grant application was funded using the insights gleaned from our platform.
The limitations of an administrative view highlight a measurement gap not only for our organization, but also for the field of public health informatics. Funders often expect clear evidence of return on investment (ROI), but this frame alone can miss the broader value of public data infrastructure. ROI analyses are best suited for quantifying direct, linear outputs. Yet the real impact of a tool like HealthyCommunitiesNC.org is often indirect, enabling the ripple effects of better-informed decisions to happen simultaneously across many different communities. The success of public data infrastructure, therefore, may not be captured by a single number we can count, but by the decisions the infrastructure silently informs every day.
From Data to Action: A Proactive Model for Community Empowerment
The challenge of measuring offline impact detailed in the previous section led us to a clear conclusion: if we wanted to better understand how our data were being used, we needed to move from passive provision to active partnership. A proactive, exploratory model begins to solve the measurement gap; through direct and curious engagement, we may learn what grants our data support and what programs our data inform. Our primary avenue for this work is the Community Data & Learning Cohort, a strategic partnership facilitated by the North Carolina Institute for Public Health (NCIPH) and supported by the Kate B. Reynolds Charitable Trust.5
Through this program, our team members act as curriculum co-developers, data literacy educators, and technical assistance (TA) providers. The work is designed to address the resource gap within many community-based organizations (CBOs) by equipping them with practical skills and confidence to engage with data. We lead a series of interactive workshops on topics like storytelling with data and effective visualization techniques, which are paired with customized, one-on-one TA sessions for 3 to 4 organizations over the course of several months.
The HealthyCommunitiesNC.org dashboard is the central learning tool in this process. A key goal of the program is to demystify data use for non-technical audiences. Participants learn how to pull pre-built visualizations directly from the dashboard to create their own professional-quality materials. This hands-on approach empowers organizations to move beyond being passive consumers of information to becoming active producers of data-driven narratives.
The primary benefit of this model is the direct empowerment of CBOs, demonstrated through concrete outputs such as funder-ready presentations and data-informed reports. By leveraging the dashboard and our hands-on technical assistance, CBOs can craft the data-driven narratives needed to strengthen grant applications, produce impact reports, and target their services. This work fundamentally elevates their internal data literacy and confidence, strengthening their ability to secure support, evaluate programs, and tell their stories effectively.
Two brief case studies illustrate this impact in action. First, the John 3:16 Center is an organization with a mission to address the impact of poverty and trauma on families with children in Halifax, Northampton, and Warren counties. This organization worked with CFC’s TA to use visualizations pulled directly from the dashboard to craft compelling funder presentations for their after-school programs, saving the organization time, effort, and prohibitive costs. Second, our team worked with a tri-county collaborative initiative comprised of the Columbus County Partnership for Children, Bladen County Smart Start, and Robeson County Partnership for Children to create data-informed reports to bolster their efforts in early childhood development and adverse childhood experiences (ACEs). It is through these dedicated engagements that data is put into action.
Conclusion: The Path to 2030 Requires Investing in Data and People
The journey to a healthier North Carolina has taught us a fundamental lesson: making data available is a necessary first step, but it is not enough. A data dashboard, no matter how powerful, is merely a well-stocked toolkit. Its value is only realized in the hands of the master craftspeople on the front lines: the community leaders, nonprofit directors, and local practitioners who have mouths to feed and lives to save. These leaders have the lived knowledge but often lack the capacity and expertise to spend precious hours wrangling spreadsheets. Our goal must be to provide them with the right tool at the right time, allowing them to efficiently gather the evidence they need to secure funding and target their impact so they can get back to the essential work that only they can do.
This understanding points toward a path forward for the remainder of this decade and beyond. We must scale strategic partnerships not only between funders and organizations like CFC that curate and translate data, but also with community organizations, agencies, and universities that can contribute clean data, technical expertise, and training. Investment is not only financial; it also means sharing datasets, aligning policies, and committing time and talent to sustain these tools as living public assets. The most effective commitment a funder can make is not in a new, glamorous project; it is the steady, year-after-year support required to maintain critical infrastructure. A long-term vision, secured by a sustainable funding model, will allow the public health community to move beyond siloed metrics. Such a vision would also link indicators across domains such as poverty, education, and health outcomes to identify lessons from communities that are outperforming expectations.
Ultimately, achieving the goals of HNC 2030 requires a shared commitment from policymakers, funders, and practitioners to support the entire ecosystem of data and people that brings information to life. Data without action is wasted potential. Action without data is a gamble. But when data fuels action, we create lasting impact for all North Carolinians.
Acknowledgments
The author thanks Morgan Cooper for her thoughtful editorial feedback, Dante Haywood for helpful suggestions on the outline, and Thomas Gomes for providing key information about the Community Data & Learning Cohort.
Financial support
This work received no specific financial support.
Disclosure of interests
The author declares no conflicts of interest.
Correspondence
Address correspondence to Dr. Anna H. Casey, Cape Fear Collective, PO Box 7746, Wilmington, NC 28406 (acasey@capefearcollective.org).