Background
Concerns about primary care access in North Carolina are intensifying. North Carolina’s population is the 8th fastest growing state in the country, in part due to migration to North Carolina from other states and immigration.1,2 Given this rapid population growth, the state is focused on understanding if there will be an adequate supply and distribution of the health care workforce to meet the growing needs of the population. Recent analyses show that 37% of 3606 physicians completing residency in North Carolina between 2017 and 2019 remained in practice in North Carolina 5 years later, a decrease in retention from the 43% of residents who graduated between 2008 and 2011.3 Overall, there has been significant growth in our primary care workforce, with physician supply increasing by 28% and physician assistants (PAs) increasing by 228% in the last 20 years.4 The nurse practitioner (NP) workforce is also growing rapidly in North Carolina, with one analysis estimating that the NP workforce in the state grew 429% between 2000 and 2022.4
“Healthy North Carolina 2030” is monitoring an important characteristic of health care access for populations: access to primary care.5,6 Primary care is foundational to the broader health care system. Individuals with access to primary care are more likely to receive preventative care, have fewer unmet health care needs, and are less likely to unnecessarily use the emergency department for care. The North Carolina Health Professions Data System (HPDS) at the Cecil G. Sheps Center for Health Services Research has been documenting primary care access through the primary care clinician (PCC) index since 2017. The PCC index seeks to measure access to primary care across North Carolina’s 100 counties by observing the supply of physicians, NPs, PAs, and certified nurse midwives (CNMs) working in primary care relative to the population. Our previous work found that NPs, PAs, and CNMs make up a growing share of the primary care workforce in higher PCC index counties.7
This analysis compares how the PCC index changed between 2017 and 2024 and investigates how changes in the underlying components of the index impact the overall index. Specifically, we analyze how population growth, the changing age/sex composition of the population, and the supply of physicians, NPs, PAs, and CNMs affected the change in the PCC index at the county level between 2017 and 2024. This “decomposition” of the index provides important information about how primary care access in North Carolina is differentially impacted by recent changes in our population and PCC supply. It also allows us to unpack if and how primary care access may be changing due to different patterns of growth among PCCs in the state.
These data can be used by policymakers, health systems, educators, and other workforce stakeholders to understand where access to primary care remains problematic and can help anticipate future changes as the state continues to experience significant population growth. The PCC index could also be helpful in monitoring changes in supply that occur due to health-systems buying practices and the expansion of staffing across the state, as well as in places such as Western North Carolina, where Hurricane Helene may have long-term impacts on supply.
Methods
The primary data source for this study was the North Carolina HPDS, which houses licensure data provided by the North Carolina Medical Board and the North Carolina Board of Nursing. Primary care physicians and PAs include those with a primary area of practice in family medicine, general internal medicine, pediatrics, or obstetrics and gynecology. We included obstetrics and gynecology because it is considered primary care by the North Carolina legislature.8 CNMs are included as PCCs.
Enumerating primary care NPs is challenging because an NP’s certification may not always align with their actual area of practice. In 2024, more than 70% of NPs had a primary care certification (e.g., family or pediatric NP). However, many of these NPs were working in non-primary care settings like hospitals. As a result, for the PCC index, we define a primary care NP as being a clinician with a primary care certification who is working in a non-hospital setting, which results in 50% of all licensed NPs being defined as working in primary care.9
We also examined population and geographic characterisics of the 100 North Carolina counties. In our analysis, metropolitan and non-metropolitan counties were delineated using the July 2023 data from the U.S. Census Bureau and the Office of Management and Budget.10 Population characteristics including size, age, and sex were drawn from the estimates of the North Carolina State Demographer.11
The methodology used to calculate the PCC index is derived primarily from the recommendations of the Negotiated Rulemaking Committee on the Designation of Medically Underserved Populations and Health Professional Shortage Areas of 2011.12 The specific methodology applied to North Carolina has been documented in detail in previous work.7 Per the recommendations of the report, we age- and sex-adjusted the population to reflect that certain populations, like the elderly, have a greater need for primary care visits.12 Also, per the report, we weighted PCCs differently based on an estimate of the relative amount of primary care services they are providing.12 However, unlike work conducted by Zolotor and colleagues (2022), we did not exclude federally employed NPs or PAs. While this will slightly inflate the number of these clinicians in certain counties, this approach ensures that the PCC index used in this paper matches the version used for “Healthy North Carolina 2030.” The PCC index is calculated using the following formula:
Population×Age/Sex Adjustment(1×PC Physicians)+(0.25×OB/GYN Physicians and PAs)+(0.75×PC NPs)+(0.75×PC PAs)+(0.75×CNMs)
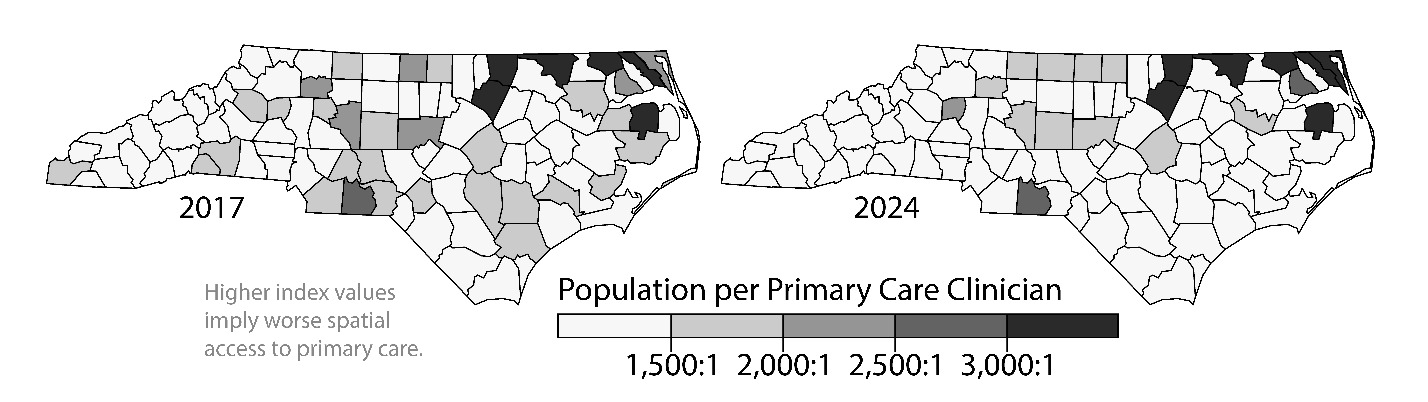
The PCC index yields a ratio of the population per primary care clinician, where a higher index indicates a county with lower access to primary care. The “Healthy North Carolina 2030” goal was 1500 people in the county to 1 PCC. Ratios higher than 1500:1 indicate lower access to primary care.
To decompose how each component of change—population growth, changes in the age/sex composition of a county’s population, and PCP, NP, PA, and CNM supply—affect the index, we used the Shapley method.13 This approach calculates how the index changes as we successively change each component and hold all other components the same. However, because the order in which each component is changed affects how much each component contributes to the overall PCC index, we averaged the contributions of each component over every combination of orderings.
Results
In 2017, when the PCC index was first calculated, 64 counties in North Carolina fell below 1500 people to 1 clinician (Figure 1), a threshold for primary care workforce adequacy relative to population suggested by the Negotiated Rulemaking Committee.12 Over the next seven years, 18 counties improved their PCC index score enough to drop below the 1500:1 ratio, while two counties had a worsening of their score and climbed above it. As a result of these shifts, 80 counties were below 1500:1 by 2024. Of the 20 counties above the threshold, 7 have an index greater than 3000:1, all of which are located in the northeastern part of North Carolina.
_index_by_county__north_carolina__2017_and_2024.png)
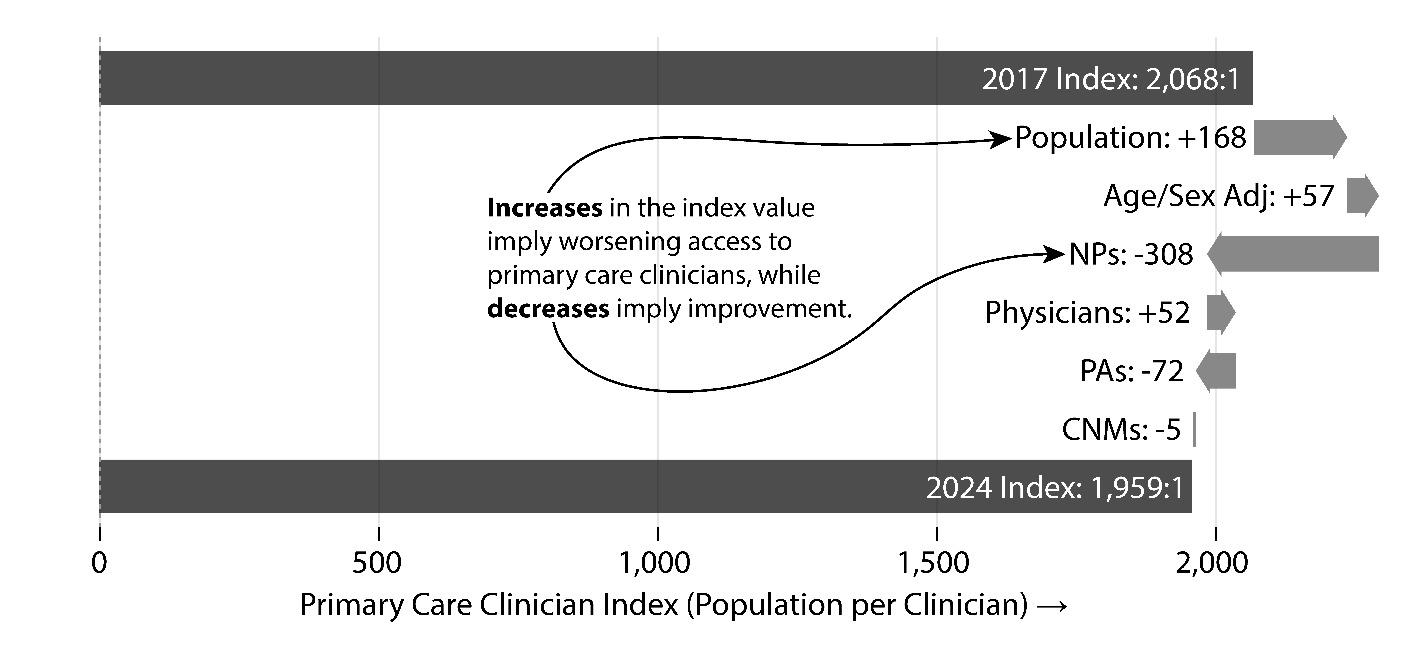
We also examined how the underlying components of the PCC index, like population growth/decline, aging of the population, and changing supply of PCCs, impacted the index between the two time periods. One way to visualize how different components of the index affect a county’s overall PCC index is to use a waterfall chart, which shows the direction and magnitude of each component’s contribution to change in the index overall (Figure 2). The first and last bars show the overall PCC index values for 2017 and 2024, respectively. The rightward-pointing bars indicate a component that pushed the index upwards (e.g., potentially lower access due to higher population per PCC), while leftward-pointing bars indicate a component that contributed to a decrease in the index (e.g., potentially higher access due to lower population per PCC).
Figure 2 illustrates the components of change for the PCC index between 2017 and 2024 for the twenty counties that were above the 1500:1 threshold. During this time, the index decreased from 2068:1 to 1959:1, representing a slight improvement for these counties. However, when we examine the components individually, we can see how different components of the index contributed to this change. For instance, growth in 11 of those 20 counties resulted in an increase of nearly 9% in population between 2017 and 2024. This growth pushed the numerator of the index upwards for these 20 high-index counties. Likewise, the aging population in these counties impacted the age/sex adjustment, also causing an increase in the index. Since 2017, 19 of these counties saw growth in the percentage of the population aged 65 or older.
At the same time, the growth in primary care NPs and PAs offset the population effects in these counties. In the 20 counties with an index above 1500:1, the supply of primary care NPs increased from 192 in 2017 to 313 in 2024, and the supply of primary care PAs also increased from 101 to 131, while the number of primary care physicians decreased slightly from 343 in 2017 to 328 in 2024.
_index_between_2017_and_2024_for_20_co.png)
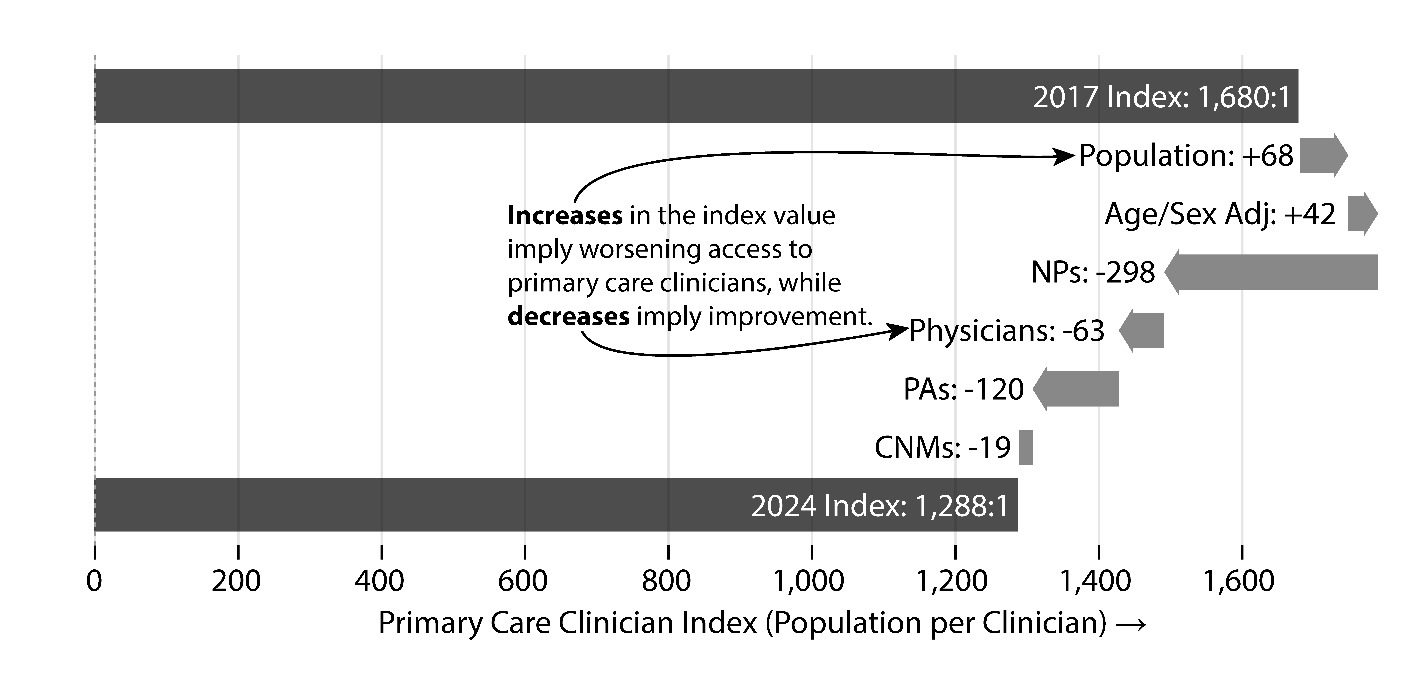
Figure 3 shows a waterfall chart for the 18 counties that moved from above the 1500:1 threshold to below the 1500:1 threshold, which illustrates the factors that contributed to counties moving from having a higher population to primary care clinician ratio in 2017 to a lower one (i.e., meeting the federal standard of having a sufficient primary care workforce). Although the population in these counties increased by nearly 5% in that time period, the growth was more than offset by growth in all types of primary care clinicians. In these 18 counties, the number of primary care NPs nearly doubled between 2017 and 2024 (183 to 360), the number of primary care PAs increased 71% (101 to 173), the number of primary care physicians increased 7.6% (353 to 382), and the number of CNMs tripled (5 to 16).
_index_between_2017_and_2024_for_18_co.png)
While some underserved counties have experienced substantial growth in primary care clinicians, this growth may have been due to new graduates who are less experienced and not fully prepared to meet the growing and diverse needs for care in primary care practices. However, the mean age of primary care NPs in rural counties was 45.7, which was slightly older than NPs in metropolitan counties (44.5, P = .0002). There were no statistically significant differences between the mean ages in counties above or below the 1500:1 threshold. Primary care PAs tended to be older in non-metropolitan counties (42.5 versus 40.6, P = .0013), while the difference between PA ages in counties above and below 1500:1 was not significant. However, physicians in both non-metropolitan counties and counties above the 1500:1 threshold were much older. The mean age of physicians in non-metropolitan counties was 53.0 compared to 48.4 in metropolitan counties (P < .00001) and was 52.9 in counties above the 1500:1 threshold compared to 48.9 in counties below (P < .00001).
In this analysis, we limited the definition of primary care NPs to NPs with a primary care certification who were working in a non-hospital setting.9 However, the “non-hospital” exclusion used may not exclude NPs who are practicing in other non-primary care settings in outpatient or group medical settings. To investigate this possibility, we examined the practice names of the primary care NPs in the licensure data. Using a list of search terms (e.g., “ortho”, “neurol”, “gastro”), we found that about 15% of the NPs we were labeling as primary care had a practice name that could plausibly be considered non-primary care. Another 3% had practice names containing the term “urgent,” indicating employment at an urgent care facility. We also found that about 3% of the NPs who were not labeled as “primary care” had a term in their practice name that strongly implied primary care (e.g., “family medicine”, “community health”). These combined adjustments would result in approximately 43% of NPs being labeled as practicing primary care compared to 50% using the original exclusion. This adjustment would result in 26 fewer primary care NPs in the 20 counties above the 1500:1 threshold and would result in two more counties moving above the 1500:1 threshold.
Conclusion
The findings from this study suggest that the state had more primary care clinicians relative to the population in 2024 compared to 2017. For counties that had significant PCC growth, NPs largely accounted for this change. North Carolina mirrors national trends in terms of experiencing a rapid growth in the primary care NP workforce in both metropolitan and non-metropolitan counties.14 In counties in North Carolina that may be facing primary care workforce shortfalls, the numbers of NPs and physicians will soon be at a similar level if trends continue.
This rapid growth in clinician supply is good news for the state. It does, however, suggest opportunities to consider how to support the integration of NPs into primary care practices in the state. The overwhelming majority of training in North Carolina is occurring in metropolitan areas and occurs in silos. There are models of interprofessional training that could be leveraged and scaled, but this will require investment in, for example, graduate medical education training for physicians that incorporates—both in training and practice—more exposure to other health professionals. Such an approach is likely to produce a workforce that can more seamlessly integrate into team-based models of care after training.
As a rapidly growing state, North Carolina is lucky to have a robust data system that allows policy makers to monitor trends in the state’s primary care workforce. Through systematic tracking of the primary care workforce, like in “Healthy North Carolina 2030,” the state can identify areas that require investments, as well as monitor outcomes of investments in training and workforce development.
Financial support
Ongoing financial support is provided by the North Carolina Area Health Education Centers (AHEC) Program Office. Although the North Carolina HPDS maintains the data system, the data remain the property of their respective licensing board.
Declaration of interests
The authors report no conflicts of interest.