Introduction
As cirrhosis prevalence has increased in the United States over the past two decades, the incidence of hepatocellular carcinoma (HCC) has also been on the rise.1,2 In North Carolina, liver cancer was the sixth leading cancer-related cause of death in 2021.3 Some risk factors for HCC include cirrhosis, male sex, Asian American and Pacific Islander race/ethnicity, certain inherited metabolic diseases, heavy alcohol use, tobacco use, obesity, and type 2 diabetes.4 The National Comprehensive Cancer Network (NCCN) and the American Association for the Study of Liver Disease (AASLD) recommend that individuals with cirrhosis receive HCC surveillance with an abdominal ultrasound every 6 months.5,6 Regular HCC surveillance improves the likelihood of earlier-stage diagnosis and opportunities for curative treatment.7–9 However, surveillance utilization among individuals with cirrhosis remains low.10–14
HCC surveillance utilization is influenced by a variety of patient-, provider-, and area-level factors. At the patient level, studies suggest that individuals with metabolic dysfunction-associated steatotic liver disease (MASLD), previously known as non-alcoholic fatty liver disease (NAFLD) or alcohol-related liver disease (ALD), have lower rates of HCC surveillance than those with hepatitis B virus (HBV) and hepatitis C virus (HCV) cirrhosis etiologies.10,13,15 Insurance type has also been found to be associated with receiving HCC surveillance, where patients with Medicaid and Medicare co-insurance had higher surveillance rates than those with Medicaid alone.15 At the provider level, studies have found that individuals receiving gastroenterology or hepatology specialty care are more likely to receive HCC surveillance.10,11,13,16 Area-level factors associated with receiving HCC surveillance are not well studied, but cost of HCC surveillance, transportation issues, and distance to a clinic may influence HCC surveillance utilization.10,17
Using data from a large, contemporary cohort from North Carolina, our study adds to the current body of literature of HCC surveillance by providing relevant and timely insights into surveillance gaps in the state, especially as MASLD prevalence continues to increase in the United States. In this study, we examine the patient-, provider-, and area-level factors associated with HCC surveillance uptake among individuals with cirrhosis. Findings from this study can help state-level stakeholders identify which patient populations to target for HCC surveillance interventions. Findings are also relevant for health care providers and patients with cirrhosis. By using multi-payer claims data, we were able to capture an extensive cohort, including most of the insured population with cirrhosis in North Carolina. The years of data used in this study also reflect recent changes in the cirrhosis etiology landscape.
Methods
Data Source
We used insurance enrollment and claims data from Medicare, Medicaid, and private plans in North Carolina.18 The data were obtained through the Cancer Information & Population Health Resource (CIPHR), a resource of the Lineberger Comprehensive Cancer Center at the University of North Carolina at Chapel Hill.19 Most of the North Carolina population with cirrhosis is enrolled in 1 of the 3 payers used in the study: Medicare covered ~15% of North Carolina’s total population in 2019, Medicaid covered ~18% of North Carolina’s total population in 2019, and private plans cover most of the private market in North Carolina.19
Enrollment data include information about periods of coverage, as well as beneficiary demographics. Insurance claims data from inpatient and outpatient settings capture information about health care encounters during covered periods, including International Classification of Diseases (ICD)-9 and ICD-10 diagnosis and procedure codes, Current Procedural Terminology (CPT) codes, Healthcare Common Procedure Coding System (HCPCS) codes, and information about the specialty of the provider.
Study Population
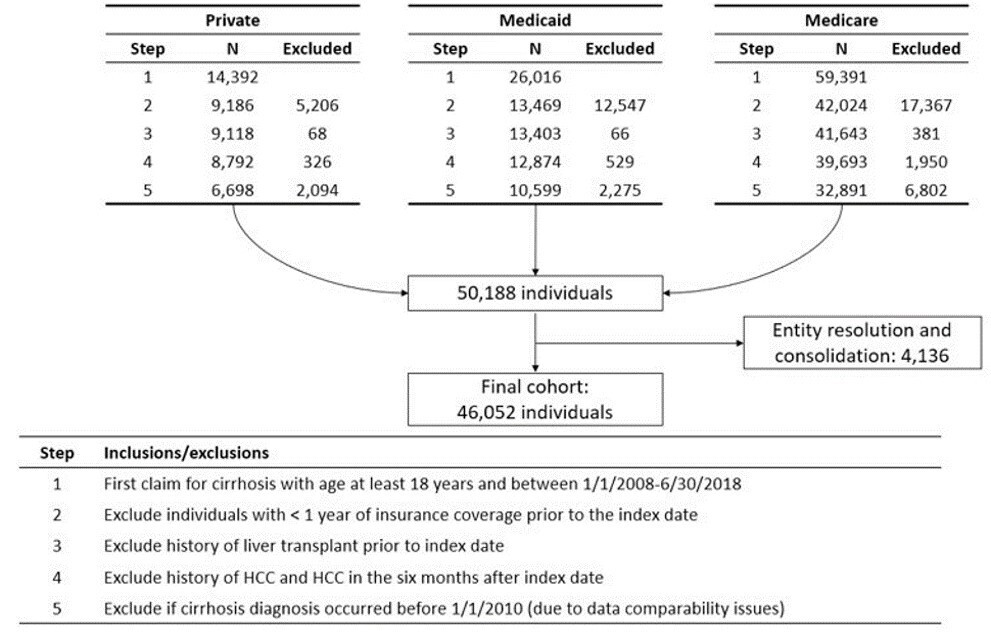
We included individuals aged 18 years or older with a first claims-based cirrhosis diagnosis code between January 1, 2010, and June 30, 2018, using ICD-9 and ICD-10 codes for cirrhosis and its resultant complications (Appendix A).20,21 We included individuals with at least 12 months of continuous insurance coverage by an individual payer before their first cirrhosis diagnosis, determined using enrollment start and end dates. The date of the first cirrhosis diagnosis is hereafter referred to as the index date. We excluded individuals with a liver transplant before the index date (ICD-9-CM: V42.7; ICD-10-CM: Z94.4) and individuals with an HCC diagnosis before the index date or in the 6 months after the index date, inclusive of the index date (ICD-9-CM: 155.0; ICD-10-CM: C22.0, C22.9). These exclusion criteria were used to avoid outcome misclassification, as abdominal ultrasound, computed tomography (CT), and magnetic resonance imaging (MRI) exams are likely diagnostic exams for these individuals (Figure 1).

As described in our previous study, we used the linkages developed by the Cancer Information and Population Health Resource at the University of North Carolina’s Lineberger Comprehensive Cancer Center to follow individuals across payers during the study period.14 A deterministic linkage including the patients’ name, date of birth, social security number, and sex was used for those enrolled in more than one payer during the follow-up. All available claims were used for those with multiple payers, but only the claims from the initial payer were used if patients had a gap in coverage.14
Study Outcome
Although guidelines recommend HCC surveillance by abdominal ultrasound, patients often receive HCC surveillance with a CT scan and an MRI.22 Therefore, we defined the main outcome of interest as HCC surveillance by abdominal ultrasound, CT scan, or MRI, determined using CPT/HCPCS codes (Appendix B). HCC surveillance exams were included regardless of indication, as the exams fulfill surveillance purposes even if administered for other intents.23 We estimated subdistribution hazard ratios and associated 95% confidence intervals to identify factors associated with HCC surveillance utilization in the first 2 years after a cirrhosis diagnosis.
Covariates
Patient-level variables. Patient-level demographic factors included age at index date, sex, race/ethnicity (White Non-Hispanic, Black Non-Hispanic, Hispanic, Other), rural/urban residence, and payer (private, Medicaid, Medicare). The rural/urban residence of each individual was defined using county-level Rural-Urban Continuum Codes (RUCC) from 2013, the most up-to-date codes at the time of the study. The codes were grouped as urban (RUCC 1, 2, 3), rural adjacent to urban areas (RUCC 4, 6, 8), and rural non-adjacent to urban areas (RUCC 5, 7, 9).24,25
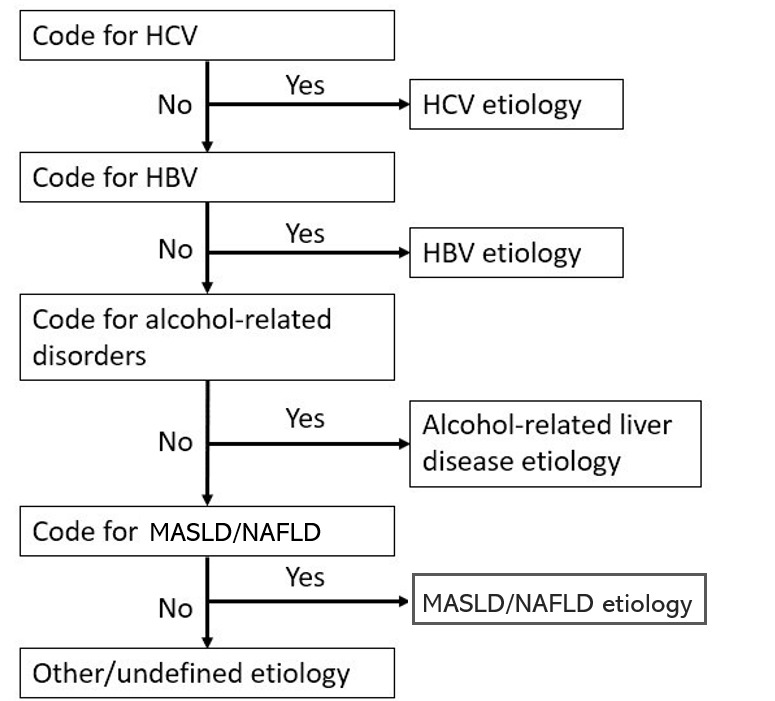
The patient-level factors also included primary cirrhosis etiology: HCV, HBV, ALD, MASLD, and “Other” etiology. The presence of at least one of the ICD-9-CM and ICD-10-CM codes in the 12 months before and in the 6 months after the index date was used to determine cirrhosis etiology. The specific ICD-9-CM and ICD-10-CM codes used to determine the cirrhosis etiology, and how they were derived, are listed in Appendix A. For individuals with more than one cirrhosis etiology, we used the hierarchical algorithm shown in Appendix C.26 Individuals without any of the aforementioned cirrhosis etiologies were categorized as “Other” and included those with autoimmune hepatitis, primary sclerosing cholangitis, and primary biliary cirrhosis, among other cirrhosis etiologies.
Decompensated cirrhosis was defined as the presence of at least one ICD-9-CM or ICD-10-CM diagnosis code for esophageal varices, ascites, variceal hemorrhage, hepatic encephalopathy, spontaneous bacterial peritonitis, or hepatorenal syndrome on or in the year before the index date (Appendix A).23 We mapped ICD-9-CM codes to ICD-10-CM codes using the Centers for Medicare and Medicaid Services General Equivalence Mappings27 and using forward-backward mapping,28 followed by a manual review by a clinician (A.M.), to account for the ICD-9-CM to ICD-10-CM transition in October 2015 (Appendix A). We also computed the Charlson Comorbidity Index (CCI) score, both with and without liver disease in the calculation, using Deyo’s ICD-9-CM and Quan’s ICD-10-CM coding algorithms.29,30
Provider-level variables. A crosswalk developed by CIPHR was used to determine the specialty of the provider associated with patients’ claims from the 12 months before and on the index date using Universal Physician Identification Number (UPIN) and National Provider Identifier (NPI) information for the Centers for Medicare and Medicaid Services (CMS) data and a separate nomenclature for the private insurance data. Gastroenterology or hepatology specialty was defined as having any gastroenterology or hepatology taxonomy code or a primary or secondary specialty variable containing the words “Gastroenterology” or “Hepatology.” Primary care provider specialty was defined as having any taxonomy code for family practice, general practice, internal medicine, and geriatric medicine, or having a primary and secondary specialty variable containing “Family Practice”, “General Practice”, “Internal Medicine”, “Preventative Medicine”, or combinations of these specialties (e.g., “Family Practice/General Practice”). We assessed whether patients received care from: 1) any gastroenterologist/hepatologist; 2) a primary care provider alone (no gastroenterologist/hepatologist); or 3) other provider type (neither gastroenterologist/hepatologist nor primary care provider) in the 12 months before the index date.
Area-level covariates. The Social Vulnerability Index (SVI), an aggregate measure of the social vulnerability of every census tract and county in the state, was used to assess social determinants of health at an area level, with a specific focus on socioeconomic status, household composition and disability, minority status and language, and housing and transportation.31 We linked the publicly available county-level SVI31 data from 2018 with the patient-level claims using patients’ zip and county codes of residence. The SVI is composed of 4 themes (socioeconomic status; household composition and disability; minority status and language, and housing and transportation) (Appendix D) and is a percentile rank measure, ranging from 0 to 1.32 We categorized the SVI variable using quartiles.
Statistical Analysis
We reported descriptive statistics for patient-, provider-, and area-level factors for the cirrhosis cohort overall and by insurance type. Specifically, we characterized the cohort by patient demographic and clinical factors and by provider specialty. We also determined the mean and standard deviations of the SVI, overall and for each of the 4 themes. For our primary analysis, we estimated associations between these multi-level factors and receipt of HCC surveillance in the first 2 years after a cirrhosis diagnosis using a subdistribution hazard model.33 HCC diagnosis, liver transplant, and death were considered competing events.
The following variables were included in the subdistribution hazard model: age (18–39 years, 40–64 years, 65+ years old); sex (male, female); rurality (urban, rural adjacent to urban, rural not adjacent to urban); primary cirrhosis etiology (HBV, HCV, ALD, MASLD, Other); Charlson Comorbidity Index score (0, 1, 2+ comorbidities); decompensated cirrhosis status; primary payer type; provider specialty (gastroenterologist/hepatologist, primary care provider, other); socioeconomic status (SVI theme 1); household composition and disability (SVI theme 2); minority status and language (SVI theme 3); and housing and transportation (SVI theme 4). The age categories were chosen to reflect differences in the data sources, with the 65+ group aligning with Medicare eligibility. Variables were selected based on a literature review of prior studies and input from a clinician (A.M.).
The SVI themes were included as separate variables, one for each SVI theme, and categorized as quartiles. Race/ethnicity distributions were included in Table 1 but not in the model, as this information was unavailable for the private payer data. However, we conducted a sensitivity analysis excluding those covered with private insurance as their primary payer and including race/ethnicity in the subdistribution hazard model. The outcome was the 2-year cumulative incidence of HCC surveillance.
The proportional hazards assumption was tested using log-negative-log survival curves and by including time-dependent covariates in the model, and the assumption was met for all variables included in the model. To assess multicollinearity, we calculated variance inflation factors, which were all below 3.5, indicating low multicollinearity; when the area-level factors were excluded, all variance inflation factors were below 2. Analyses were conducted using SAS statistical software (version 9.4; SAS Institute Inc, Cary, North Carolina).
Results
There were 46,052 individuals included in the cohort. The mean age was 63 years (standard deviation: 14 years), and most individuals were White Non-Hispanic race/ethnicity (73%), followed by Black Non-Hispanic (23%), Other (3.1%), and Hispanic (0.9%) race/ethnicities. There were slightly more males than females (54% versus 46%). Aside from the “Other” category (43%), the most common cirrhosis etiology was ALD (21%), followed by HCV (19%), MASLD (16%), and HBV (1.2%). Approximately 41% of individuals had a claim for decompensated cirrhosis at the index date.
Of the 46,052 included, 9% were enrolled in more than one payer. For these individuals, we determined a primary payer; private insurance was considered the primary payer for those with Medicare/private enrollment, and Medicare was considered the primary payer for those with private or Medicaid enrollment along with enrollment in Medicare.14 In total, 71% were identified with an index date in Medicare claims, 15% in Medicaid claims, and 14% in private insurance claims.
A little over half (54%) of individuals had a claim from a primary care provider alone, while 42% had at least one claim from a gastroenterologist/hepatologist provider in the year before and including the index date. The remaining 4% of individuals did not have a claim for either a gastroenterologist/hepatologist or a primary care provider in the year before the index date. The mean overall SVI was 0.47 (standard deviation, 0.27), suggesting that the counties represented by the individuals in the cohort had roughly an average score on the social vulnerability index compared to other counties in North Carolina (Table 1).
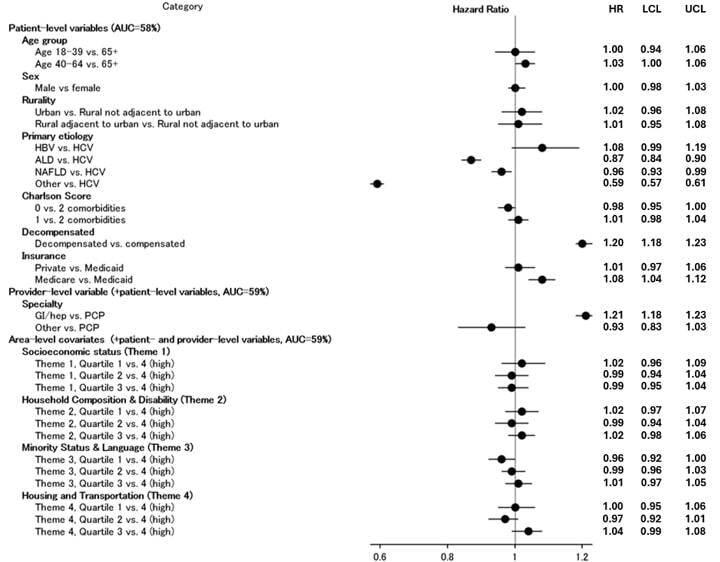
In a prior study with the same cohort, we found that the 1- and 2-year cumulative incidences for HCC surveillance were 48.5% (95% confidence interval [CI], 48.2%–48.9%) and 54.7% (95% CI, 54.3%–55.1%), respectively.14 In other words, slightly more than half of individuals received an HCC surveillance exam in the 2 years after their cirrhosis diagnosis. Patients with ALD (hazard ratio [HR], 0.87; 95% CI, 0.84–0.90), MASLD (HR 0.96; 95% CI, 0.93–0.99), and Other (HR 0.59; 95% CI, 0.57–0.61) cirrhosis etiologies were less likely to receive HCC surveillance than those with HCV etiology. Those with HBV etiology were more likely to receive HCC surveillance than individuals with HCV etiology, though these findings were not statistically significant (HR 1.08; 95% CI, 0.99–1.19) (Figure 2).

The 2-year subdistribution-specific HR for HCC surveillance was higher for those with decompensated cirrhosis than for those who had compensated cirrhosis at the time of diagnosis (HR 1.21; 95% CI, 1.18–1.23). Additionally, individuals with Medicare insurance were more likely to receive HCC surveillance compared to those with Medicaid insurance (HR 1.11; 95% CI 1.07–1.16). Having private insurance was not significantly associated with the uptake of HCC surveillance in the 2 years after the cirrhosis diagnosis. At the provider level, the subdistribution HR for HCC surveillance was lower among individuals who had a claim from a PCP alone in the year before their cirrhosis diagnosis, compared to individuals who had a claim from a gastroenterologist or hepatologist in the year before their cirrhosis diagnosis (HR 1.21; 95% CI, 1.18–1.24). There were no significant differences in HCC surveillance uptake between Quartiles 1 and 4 for each of the SVI themes (Figure 2). In the sensitivity analysis including the race/ethnicity variable in patients with Medicare or Medicaid as their primary payer, there were no significant associations between race/ethnicity and HCC surveillance in the 2 years after cirrhosis diagnosis.
Discussion
In this study, we assessed patient-, provider-, and area-level factors associated with HCC surveillance utilization in a large cohort of individuals with cirrhosis in North Carolina. Our findings suggest that individuals with ALD, MASLD, and other cirrhosis etiologies were less likely than their counterparts to receive an initial HCC surveillance exam in the first 2 years after the index date. Those with Medicare insurance, decompensated cirrhosis, and care from a gastroenterologist or hepatologist were more likely than their counterparts to receive an initial HCC surveillance exam in the first 2 years after the index date.
At the patient level, neither age nor sex was associated with HCC surveillance, although male sex and older age are well-established risk factors for HCC.34 In one prior study using Medicaid data, younger age was associated with increased HCC surveillance uptake; in another study using North Carolina data from 3 large safety-net hospitals, age was not associated with increased HCC surveillance.16,35 In our study, rural/urban residence was not associated with HCC surveillance, which is consistent with a prior study using NC Medicaid data.16
Additionally, we found that individuals with decompensated cirrhosis were more likely to receive HCC surveillance than those with compensated cirrhosis, which is consistent with results from other studies.13,36,37 While guidelines do not recommend HCC surveillance for individuals with Child Pugh C cirrhosis who are not transplant candidates, as these patients are unlikely to receive a survival benefit from HCC surveillance,6 providers may monitor patients with prior decompensation and perform routine cirrhosis care given the overt complications of liver disease. Patients with decompensated cirrhosis may also have higher surveillance uptake rates given the increased risk of HCC and greater likelihood of being seen at tertiary care centers and by gastroenterologists/hepatologists.
Regarding cirrhosis etiology, our results are consistent with prior studies that found higher rates of HCC surveillance among individuals with viral hepatitis etiologies and lower surveillance rates among individuals with MASLD and ALD.10,35–37 Unlike MASLD and ALD, HCV infection can easily be diagnosed with laboratory testing, and patients may be more likely to receive a subsequent specialty referral. These results are concerning, because the prevalence of alcohol-related cirrhosis and MASLD-related cirrhosis has been increasing.2 To address the unmet need of HCC surveillance among MASLD patients, the American Gastroenterological Association published a clinical practice update in 2020, emphasizing that surveillance exams should be offered for patients with MASLD, especially as the incidence of MASLD-related HCC has been increasing.38 As with the MASLD group, we found that those with “Other” cirrhosis etiology were less likely to initiate HCC surveillance uptake. Given difficulties identifying MASLD etiology, the “Other” etiology category is likely composed of patients with MASLD. Improved HCC risk stratification tools for patients with ALD and MASLD may help address the lower rates of HCC surveillance uptake among these groups.
At the provider-level, we found that patients who received care from a gastroenterologist/hepatologist were more likely to have an HCC surveillance exam than those who did not, which is consistent with findings from prior studies.10,11,16,37 A recent meta-analysis on HCC surveillance in patients with cirrhosis showed that receipt of care from a gastroenterology/hepatology clinic and the number of clinic visits were the strongest correlates with receiving HCC surveillance.13 In a study conducted in North Carolina, McGowan and colleagues found that fewer than half of the 345 primary care providers who completed a survey on beliefs towards HCC surveillance recommended HCC surveillance to patients with cirrhosis.39 Those who did not recommend HCC surveillance to patients with cirrhosis preferred to defer the recommendation to a gastroenterologist or hepatologist, and nearly a quarter were unaware of the guideline recommendations for HCC surveillance.39 Taken together with our study results, these findings emphasize a need for interventions to increase HCC surveillance in primary care settings. At the area level, we did not find that the SVI variables were strongly associated with HCC surveillance.
A strength of our study is the use of multi-payer claims data, allowing us to include an extensive and clinically diverse population of individuals with cirrhosis in North Carolina. Using all 3 data sources allows for greater generalizability to the patient population with cirrhosis. For instance, the Medicare and private insurance data included a larger proportion of those with MASLD and ALD, while the Medicaid data included a larger proportion of individuals with HCV. With the more recent years of data, we were also able to characterize factors associated with HCC surveillance considering recent trends and changes in cirrhosis etiology.
However, this study has a few limitations. First, using claims data, we were unable to assess some patient-level barriers to surveillance identified in prior studies, including cost- and transportation-related barriers and difficulty scheduling an appointment.17,40 The data from the private plans also lack information on race and ethnicity, though we conducted a sensitivity analysis including race/ethnicity among those with Medicare or Medicaid as the primary payer.
The potential for misclassification of cirrhosis etiology should also be taken into consideration, as we did not have laboratory data to confirm viral hepatitis etiology. MASLD is also often under-reported and under-diagnosed when using ICD-9/10 codes.41 However, the codes used for identifying MASLD cirrhosis etiology were established by a panel of experts and large database studies.42 Additionally, the inclusion criteria requiring 12 months of continuous enrollment by an individual payer may introduce selection bias, and the cohort may not truly reflect the population with cirrhosis in North Carolina.
There is also a potential for misclassification of diagnostic exams as screening exams, although a diagnostic exam would serve the function of a screening exam even if not the original intent. Lastly, the findings may not be generalizable to those insured through the U.S. Department of Veterans Affairs (VA) or those who are uninsured. Specifically, ~11% of the North Carolina population is not covered by any insurance, ~3% are covered by military insurance, and ~16% are covered by other private insurance plans separate from the ones included in this study.43
Conclusion
In conclusion, we identified several factors associated with the HCC surveillance uptake in the 2 years after patients are diagnosed with cirrhosis. Findings from this study may serve as a benchmark to measure state-level progress in increasing HCC surveillance overall and among subgroups of individuals with cirrhosis in North Carolina. Findings may also help guide future interventions in improving HCC surveillance rates, especially for patients with Medicaid insurance and with ALD and MASLD etiologies.
Financial support
This work was supported by the Cancer Information and Population Health Resource at the UNC Lineberger Comprehensive Cancer Center, with funding provided by the University Cancer Research Fund via the State of North Carolina. The findings and conclusions in this manuscript are those of the authors and do not necessarily represent the view of the North Carolina Department of Health and Human Services Division of Public Health.
Disclosure of interests
Andrew M. Moon: Consultant for TARGET RWE; A. Sidney Barritt: TARGET RWE, Merck, and Abbott molecular in the past 24 months; Stephanie B. Wheeler: Received grant funding paid to the institution from Pfizer and Astra Zeneca.
