
North Carolina’s Nursing Deficit and the Expansion Underway
North Carolina requires approximately 7000 newly licensed nurses to enter the workforce each year.1 According to the NC Health Talent Alliance’s (NC HTA) 2025 annual analysis, the state’s nursing programs are producing roughly 4250 newly licensed registered nurses annually, yielding an estimated deficit of 2710 registered nurses (RNs) per year. Licensed practical nurses (LPNs) face an additional annual shortfall of 620 (Table 1).2
Progress is evident. Educational output of newly licensed Bachelor of Science in Nursing (BSN) and Associates Degree in Nursing (ADN) graduates has grown 14.9% over three years, and the state’s licensed RN population has increased 10.6% over five years.3,4 North Carolina has supported this momentum with substantial investments: $55 million to community colleges for health care program expansion and $40 million to the University of North Carolina (UNC) System for nursing education growth.5,6
A preliminary scenario modeled in the 2025 NC HTA analysis suggests that if educational output continues growing at 14.9% over three years and Lightcast’s projected 14.2% demand reduction materializes, the annual RN deficit would narrow to approximately 1090 nurses by 2028—a substantial residual deficit.2 Turnover compounds the challenge. RN churn, a measure of the total volume of hires and exits relative to the existing workforce, stands at 43% statewide, with open position rates reaching 27% in behavioral health and 24% in public health settings.2 For LPNs, churn exceeds 96% statewide.2
These figures underscore the urgency of the challenge: despite progress, North Carolina is facing a significant deficit of licensed and practicing RNs and LPNs. As the state invests in scaling nursing education, downstream operational requirements such as faculty, preceptors, and clinical sites must be available for nursing education to be successful. This commentary focuses on the understanding of these downstream operational requirements, posing the question: are downstream operational requirements—faculty, preceptors, clinical sites—sufficiently understood to be able to convert investments in nursing education into additional graduates? Evidence from recent capacity mapping research indicates that the operational requirements are considerably larger and more complex than most planning conversations acknowledge.
A First-of-its-Kind Capacity Mapping Study
The NC Chamber Foundation, in partnership with the NC HTA, conducted a capacity mapping study with three North Carolina community colleges. Collectively, these institutions train several hundred nursing students annually across up to six RN program tracks—traditional ADN programs and LPN-to-RN bridge programs—with varying cohort sizes, scheduling patterns, and growth trajectories.7 The initiative was straightforward in concept but, to the author’s knowledge, had not previously been conducted systematically.
Each institution’s program structures—every course, lab, and clinical rotation—were mapped onto a calendar, and the precise faculty and preceptor full-time equivalents (FTEs) required to deliver each component were calculated by session type, by week, and by semester across projections through 2029.7 Because cohort sizes, program mix, and enrollment plans evolve year to year as programs scale and pipelines mature, weekly demand patterns differ across projection years. Figures 1 and 2 present the 2027 academic year as a representative snapshot, illustrating the institutional and regional dynamics observed throughout the projection window rather than a single-year anomaly.
The distinction between session types is consequential. Nursing programs comprise three fundamentally different instructional modes: classroom sessions, laboratory sessions, and clinical sessions. Each carries different staffing ratios and human capital demands. Clinical sessions further subdivide into instructor-led groups (typically one faculty member per 8–10 students), precepted experiences (1:1 or 1:2 ratios), simulations, and observation placements.8,9
The resulting analysis produced three notable findings.
Finding 1: Clinical Training Generates 3 to 8 Times More Human Capital Demand Than Classroom and Lab Instruction
Across the three institutions studied, clinical sessions consistently generated faculty and preceptor FTE requirements—the equivalent number of full-time instructors and clinical supervisors needed to staff each component—that far exceeded those of classroom and laboratory instruction by a factor of approximately 3 to 8, depending on the institution, semester, and mix of clinical types.
In a typical spring semester across the three institutions combined, clinical sessions required approximately 25 faculty FTEs and 37 preceptor FTEs, for a combined clinical workforce of 62 FTEs. By comparison, classroom instruction for the same programs required five faculty FTEs and lab instruction required two faculty FTEs. The clinical-to-non-clinical human capital ratio for that semester was approximately 9:1.
The 3-to-8-times range reflects several sources of variation: the mix of clinical instruction modes (semesters heavy on precepted experiences produce higher ratios than those emphasizing simulation); program type (traditional ADN and LPN-to-RN bridge programs carry different clinical loads at different curricular stages); position within the program sequence (early semesters are more classroom-intensive, while later semesters shift toward clinical rotations and capstone preceptorships); and institutional scheduling choices (how rotations are sequenced, whether summers carry clinical loads, and how cohorts are staggered).
The direction of the effect, however, is consistent. In every institution, every semester, and every year modeled, clinical sessions dominated the human capital picture. Each seat added to a nursing program carries a clinical staffing cost that is multiples larger than the classroom or lab cost—a cost frequently absorbed by employer partners that provide preceptors and clinical sites.
Finding 2: Institutional Demand Patterns Vary Substantially
Disaggregation of the data at the institution level, examined at the weekly level, produced a second finding: three institutions operating similar program types within the same state produced markedly different staffing demand profiles (Figure 1).
Institution A exhibits steady faculty demand of 10–15 FTEs weekly, punctuated by preceptor spikes of 37–38 FTEs when precepted rotations cluster. Institution B is faculty-dominant, peaking at 36 FTEs in week 6 of the fall semester, with preceptor demand reaching 28 FTEs in a single concentrated spike in week 5 of the fall semester. Institution C displays yet another pattern: preceptor demand surges to 40 FTEs during spring term weeks 9, 11, 12, and 13, then drops to zero across the entire fall term.
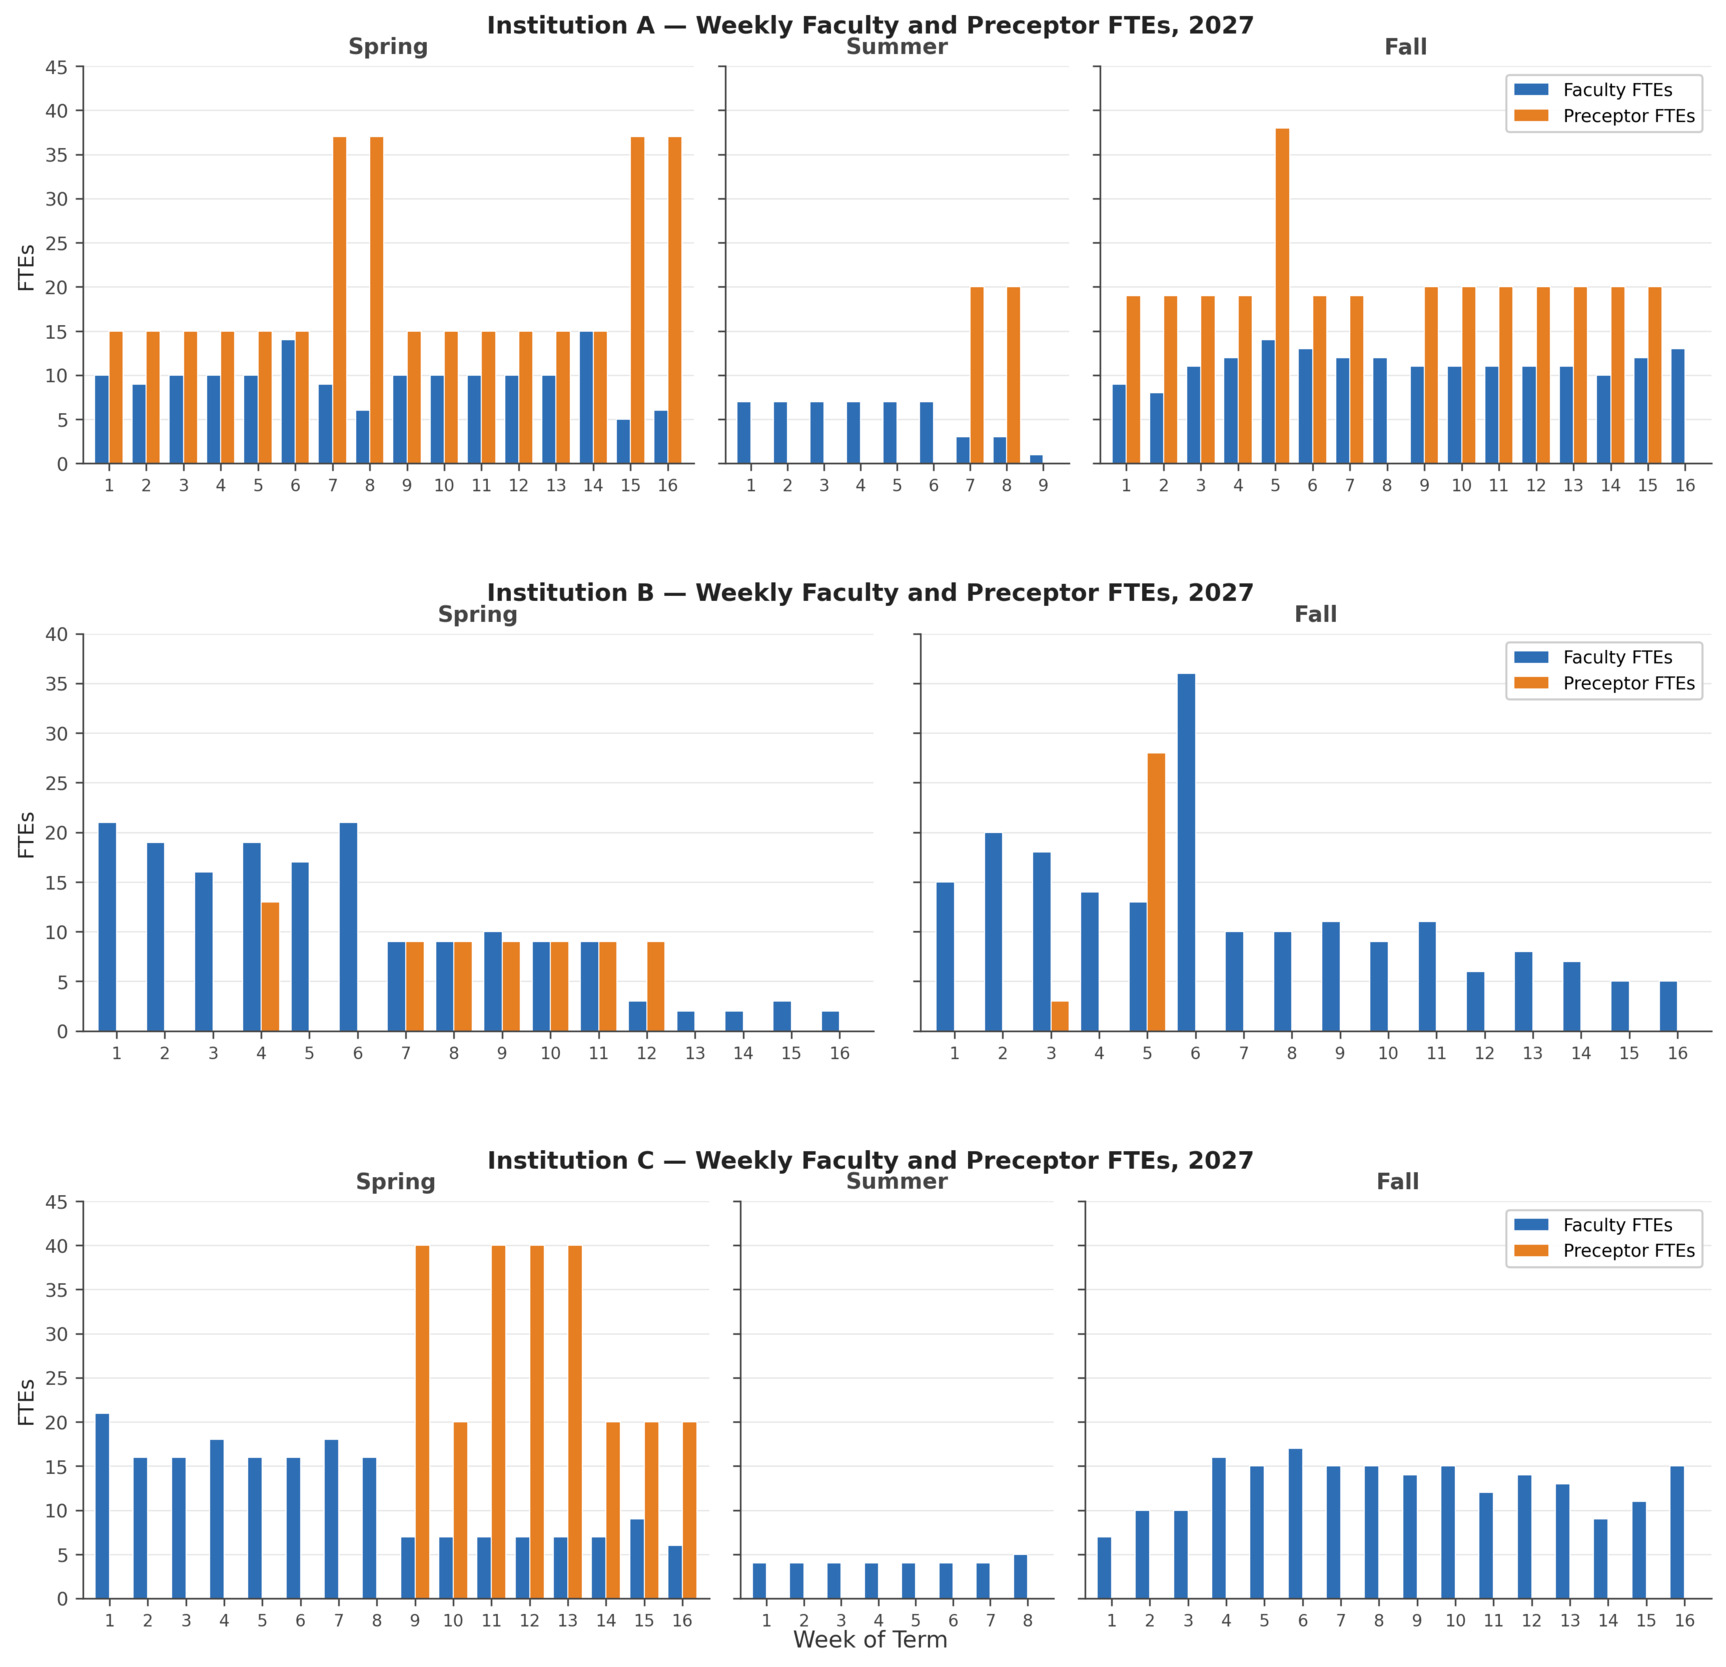
These differences reflect the specific combination of program types each institution operates, the way cohorts are sized and sequenced, when clinical rotations fall within the term, and which clinical modes are used at each stage. The practical implication is significant: aggregate planning using averages or statewide ratios will systematically misrepresent what any individual institution requires. Each program must be mapped individually to identify actual demand. This visibility is equally valuable for the clinical partners—hospitals, long-term care facilities, and behavioral health practices—that must plan their own capacity around the educational demand they absorb.
Finding 3: Regional Aggregation Reveals Overlapping Demand Peaks
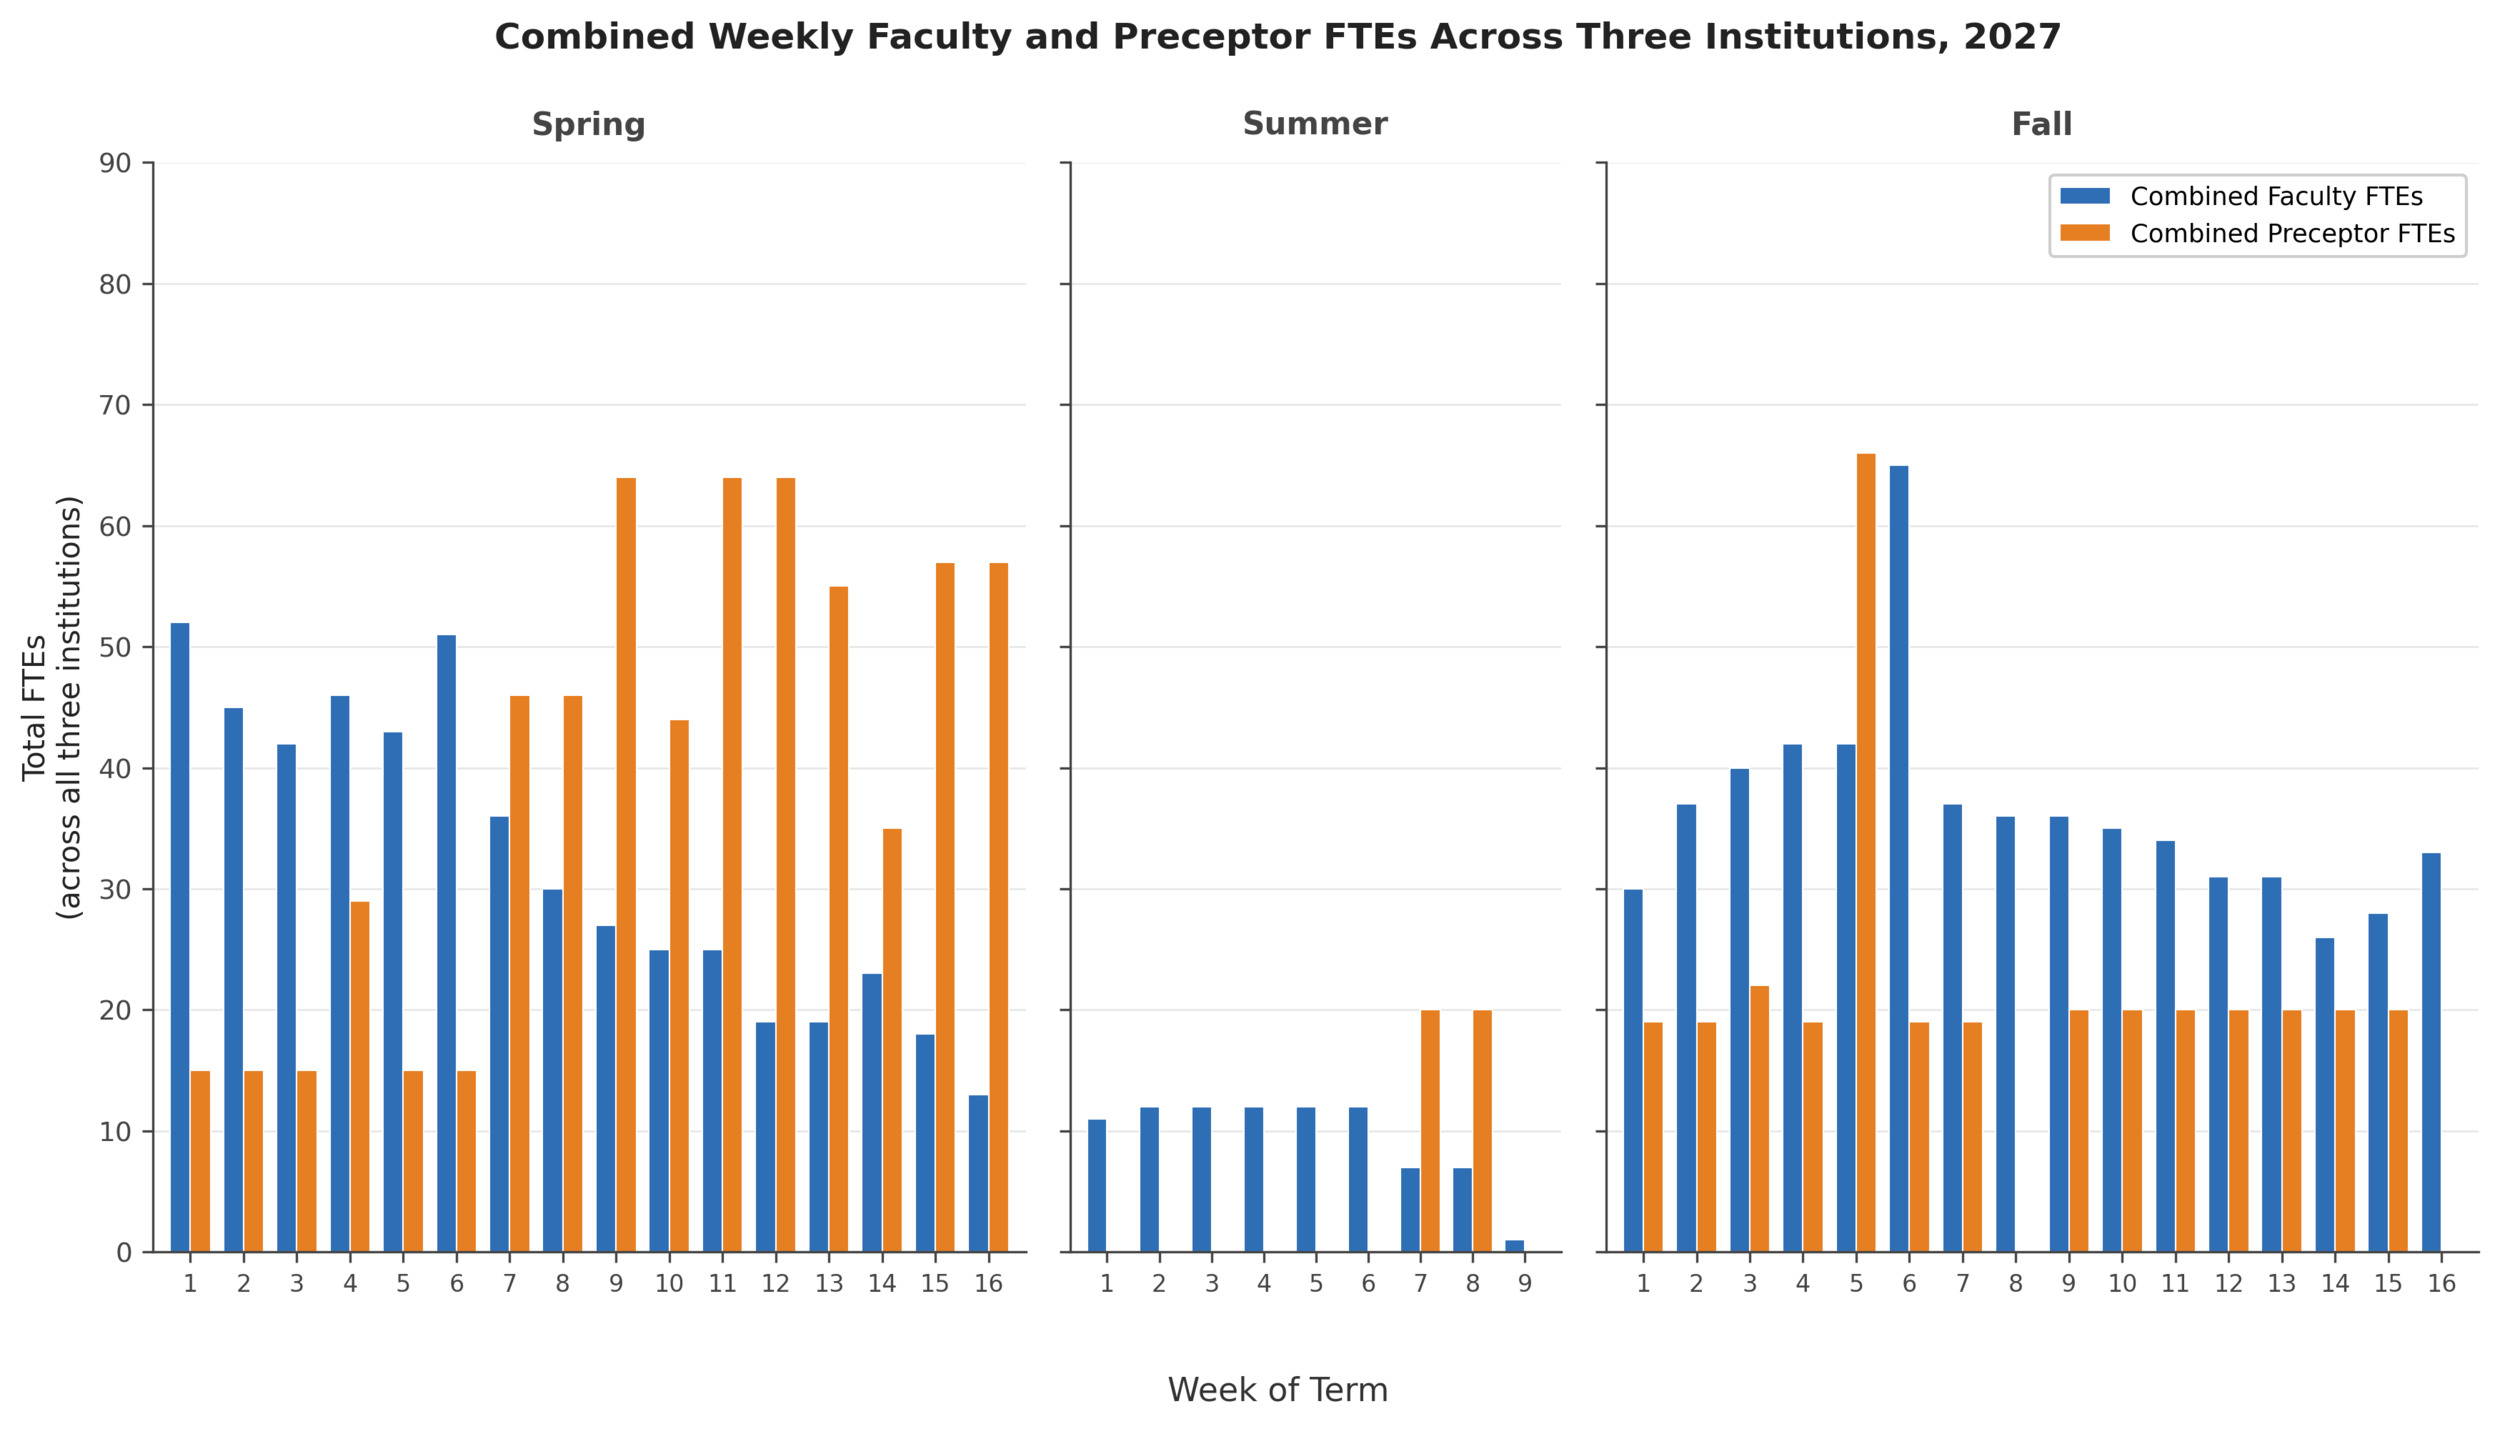
The challenge compounds at the regional level. When the three institutions’ programs overlap on a shared calendar, the combined weekly demand for faculty and preceptors reveals peaks that no single institution produces independently (Figure 2).

In the spring term, combined preceptor demand peaks at 64 FTEs across multiple weeks, creating extended periods of concentrated pressure on clinical sites. In the fall term, combined preceptor demand reaches its annual peak of 66 FTEs in week 5, followed by the combined faculty peak of 65 FTEs in week 6—back-to-back weeks that together require 192 clinical instructional personnel across the region. Summer terms present a markedly different profile with combined preceptor demand near zero across most weeks and brief spikes to 20 FTEs during compressed rotation activity.
These patterns matter because preceptors and clinical sites are shared resources. A single hospital system, long-term care facility, or behavioral health practice may receive placement requests from all three institutions simultaneously. Without a shared view of when demand peaks and where it concentrates, scheduling collisions and site overload are not potential complications; they are certainties.
Implications for Expansion Planning
North Carolina’s $95 million investment in nursing education expansion is adding seats, sections, and faculty lines.5,6 The research presented here surfaces a question that investment alone cannot answer: for each additional seat created, how many additional preceptor hours, clinical site placements, and weeks of supervised practice are required, and can the region actually provide them?
The evidence indicates that the answer is neither obvious nor simple. Clinical capacity is not a single figure that can be checked against a threshold. It is a weekly, specialty-specific, institution-by-institution resource demand that shifts with cohort sizes, program structures, and scheduling choices. A region may have adequate total clinical hours in aggregate while facing acute shortages of mental health preceptors during specific weeks or medical-surgical site availability during peak periods. The constraint is not only volume, but also timing, specialty, and coordination.
Capacity mapping provides the ability to identify constraints before they materialize. For colleges considering enrollment increases, it offers the full picture of what expansion requires—not only additional seats, but the downstream clinical infrastructure needed to support them. Should an institution plan to add 30 ADN seats in fall 2028, the downstream clinical demand—in preceptor FTEs, by specialty, by week—can be projected and compared against available capacity while there is still time to act. Without such mapping, constraints surface late, forcing programs to scramble for alternative placements that often fall short of authentic bedside experience. Over time, this dynamic can erode confidence in the system’s ability to absorb growth, contributing to hesitancy among programs to expand even when funding and demand support expansion.
The same operational view also reveals coordination opportunities that are otherwise invisible. Staggered clinical rotations across institutions can reduce peak-week preceptor demand. Simulation substitution for select clinical hours, where accreditation standards allow, can relieve site pressure during high-demand periods.10 Shared preceptor arrangements across programs can improve utilization of supervisors who would otherwise be idle during off-peak weeks. Each of these interventions requires a shared, calendarized picture of demand—precisely what has been missing.
Path Forward
The research presented here represents one component of a broader set of tools and workflows the NC Chamber Foundation is developing with the NC HTA to strengthen workforce planning in North Carolina.7,11 The capacity mapping approach connects regional output targets to the precise operational requirements for achieving them. It does not replace the judgment of educators, employers, or regulators, but it provides each with a shared, evidence-based foundation from which to address questions of enrollment scale, preceptor incentive design, and policy governing clinical training requirements.
These findings are preliminary, drawn from three institutions, and should be interpreted as an initial proof of concept rather than statewide conclusions. The patterns, however, are sufficiently clear to warrant attention. Clinical training is the dominant driver of human capital demand in nursing education, and that demand varies substantially by institution, program type, semester, and week. Clinical training is also where the translation from classroom knowledge to hands-on nursing competency occurs, rendering robust and sufficient clinical rotations essential not only for program completion but for patient safety. Planning nursing workforce expansion without accounting for these realities is planning in the dark.
North Carolina’s investments in nursing education are substantial and well-directed. The challenge now is to match them with the operational precision necessary to ensure that each additional seat produces an additional nurse, not an additional bottleneck. Although the present study focused on nursing, the capacity mapping approach is directly applicable to other high-need healthcare fields—including respiratory therapy, surgical technology, and dental hygiene—where clinical training requirements create similar downstream demands on shared employer and site resources.
Acknowledgments
This research was conducted through the NC Chamber Foundation in collaboration with the NC Center on the Workforce for Health and the NC Health Talent Alliance. The author gratefully acknowledges the three participating community college partners and the contributions of NC AHEC regions, participating employers and educators, and the many workforce and education partners who inform this work.
Declaration of Interests
The author reports no conflicts of interest.
Correspondence
Address correspondence to Vincent Ginski, 701 Corporate Center Dr. Suite 275, Raleigh, North Carolina 27607 (vginski@ncchamber.com).