
Introduction
Epidemiology and the Burden of Obesity
Obesity is a complex, multifactorial disease influenced by genetic, environmental, and behavioral factors.1 Defined as a body mass index (BMI) ≥ 30 kg/m2, obesity substantially increases risk for cardiovascular disease, type 2 diabetes, certain cancers, and other non-communicable diseases (NCDs),2–5 contributing to significant morbidity, premature mortality, and rising health care expenditures.6,7
As of 2023, 40.3% of US adults were classified as obese,8 among the highest rates in the Organization for Economic Cooperation and Development (OECD) nations.9 In North Carolina, this burden is particularly pronounced: from 2001–2015, North Carolina consistently reported the highest proportion of medical expenditures attributable to obesity among the 18 most populous US states (North Carolina: 10.37%–14.55%, versus national average: 6.13%–7.91%).10 These patterns underscore the urgency of developing multifaceted prevention strategies that integrate biological, psychological, and sociocultural perspectives.11
Epidemiology and the Burden of Depression
Depression, characterized by persistent low mood, anhedonia, fatigue, and impaired concentration, significantly impedes daily functioning.12 In 2019, the United States had the highest disability-adjusted life years (DALYs) due to depressive disorders globally (2234.69 DALYs per 100,000 population).13 Beyond its psychological impact, depression is associated with chronic pain, diabetes, reduced work productivity, and increased health care utilization,14–17 contributing to an estimated $333 billion economic burden in 2019.18
In 2020, 20.8% of adults in North Carolina reported a lifetime diagnosis of depression, exceeding the national average of 18.4%.19 Unfortunately, prevalence has continued to rise with COVID-19 pandemic-induced social isolation, financial distress, uncertainties, and systematic disruptions to mental health services.20
Relationship between Obesity and Depression
Research indicates high comorbidity between obesity and depression.21 Shared physiological mechanisms, including dysregulation of the hypothalamic-pituitary-adrenal (HPA) axis, inflammatory pathways, and neurotransmitter imbalances, likely contribute to their bidirectional relationship.22 Behavioral factors, such as emotional eating or sedentary lifestyles, further reinforce this association.22 Moreover, obesity-related stigma can exacerbate psychological distress, increasing susceptibility to depression.23,24 Therefore, understanding these conditions’ interactions is crucial for informing integrated prevention and treatment strategies.
Health-Related Quality of Life, Physical Functioning, and Relationships with Obesity and Depression
Health-related quality of life (HRQoL) is a comprehensive, subjective assessment of well-being.25,26 Physical functioning (PF), the capacity to perform essential tasks (e.g., climbing stairs, bathing, self-care), is a fundamental component of HRQoL, serving as a critical determinant of autonomy, injury risk, depression, and individual/societal health care costs.27,28 In 2023, 12.2% of North Carolina adults reported frequent physical distress (poor physical health for 14+ days in past 30 days),29 and HRQoL declined ~8% globally during the COVID-19 pandemic.30 These trends underscore the growing importance of understanding PF and its determinants.
Both obesity and depression are independently associated with diminished PF. Obesity contributes to mobility restrictions, musculoskeletal strain, and joint degeneration,31–34 whereas depression contributes to fatigue, inactivity, and reduced motivation for self-care.35–37 Although prior studies have examined these relationships separately, few have evaluated whether co-occurring obesity and depression are associated with greater declines in PF over time, despite obese individuals being 1.26 times more likely to experience depressive symptoms than their non-obese counterparts.38 Determining whether their co-occurrence is associated with worse HRQoL and PF is therefore important for informing prevention strategies.
Clergy Population and Study Aims
Occupational stressors are a well-documented risk factor for obesity39,40 and depression.41,42 United Methodist Church (UMC) clergy in North Carolina face distinct vocational stressors, including demanding and unpredictable work schedules, emotional labor, and navigating politically polarized congregations.43–45 These challenges contribute to above-average rates of obesity (46% in 2023), severe class III obesity (BMI ≥ 40), and NCDs in North Carolina UMC clergy relative to demographically similar North Carolinians, with many prevalences increasing significantly between 2008 and 2023.46,47
Similarly, depressive symptoms among North Carolina UMC clergy increased significantly since 2019, driven by heightened political tensions, uncertainty surrounding UMC policies on sexuality, and the COVID-19 pandemic.45 During this period, many North Carolina UMC clergy either maintained or developed high depressive symptoms, while relatively few improved,48 underscoring the need for proactive mental health interventions.
Despite these documented risks, few studies have examined how obesity and depression are jointly associated with PF in clergy. Therefore, this study aims to:
-
Examine independent and joint prospective associations of obesity and depression with PF.
-
Determine if their comorbidity accelerates PF decline beyond the sum of individual prospective associations, and if so, the magnitude of this combined association.
-
Inform clinical decision-making by identifying the potential need for targeted interventions in clergy and other high-risk occupational groups.
We hypothesize that both conditions will be negatively associated with PF, and that their co-occurrence will be associated with greater PF decline over time.
Methods
Study Design
We utilized data from the Clergy Health Initiative Longitudinal Survey (CHILS), a panel study initiated in 2008 aiming to assess the physical, mental, and spiritual well-being of North Carolina UMC clergy.49 Initially enrolled participants were invited to subsequent survey waves regardless of retirement, relocation, career change, or prior nonparticipation. For this analysis, data from the most recent waves containing measures of PF (baseline in 2014; follow-up in 2016) were utilized to examine the associations between obesity, elevated depressive symptoms, and PF decline over time.
Setting
North Carolina is the 9th-most populous US state with ~11.04 million residents (2024).50 Its demographic composition is predominantly White, followed by Black and Hispanic populations.50 Christianity is the dominant religious affiliation; the UMC is the third largest Christian denomination in the United States and the second largest in North Carolina.51
Participants
Eligible full- and part-time clergy were identified from publicly available directories of the North Carolina52 and Western North Carolina UMC conferences53 and recruited via email, mail, and telephone.
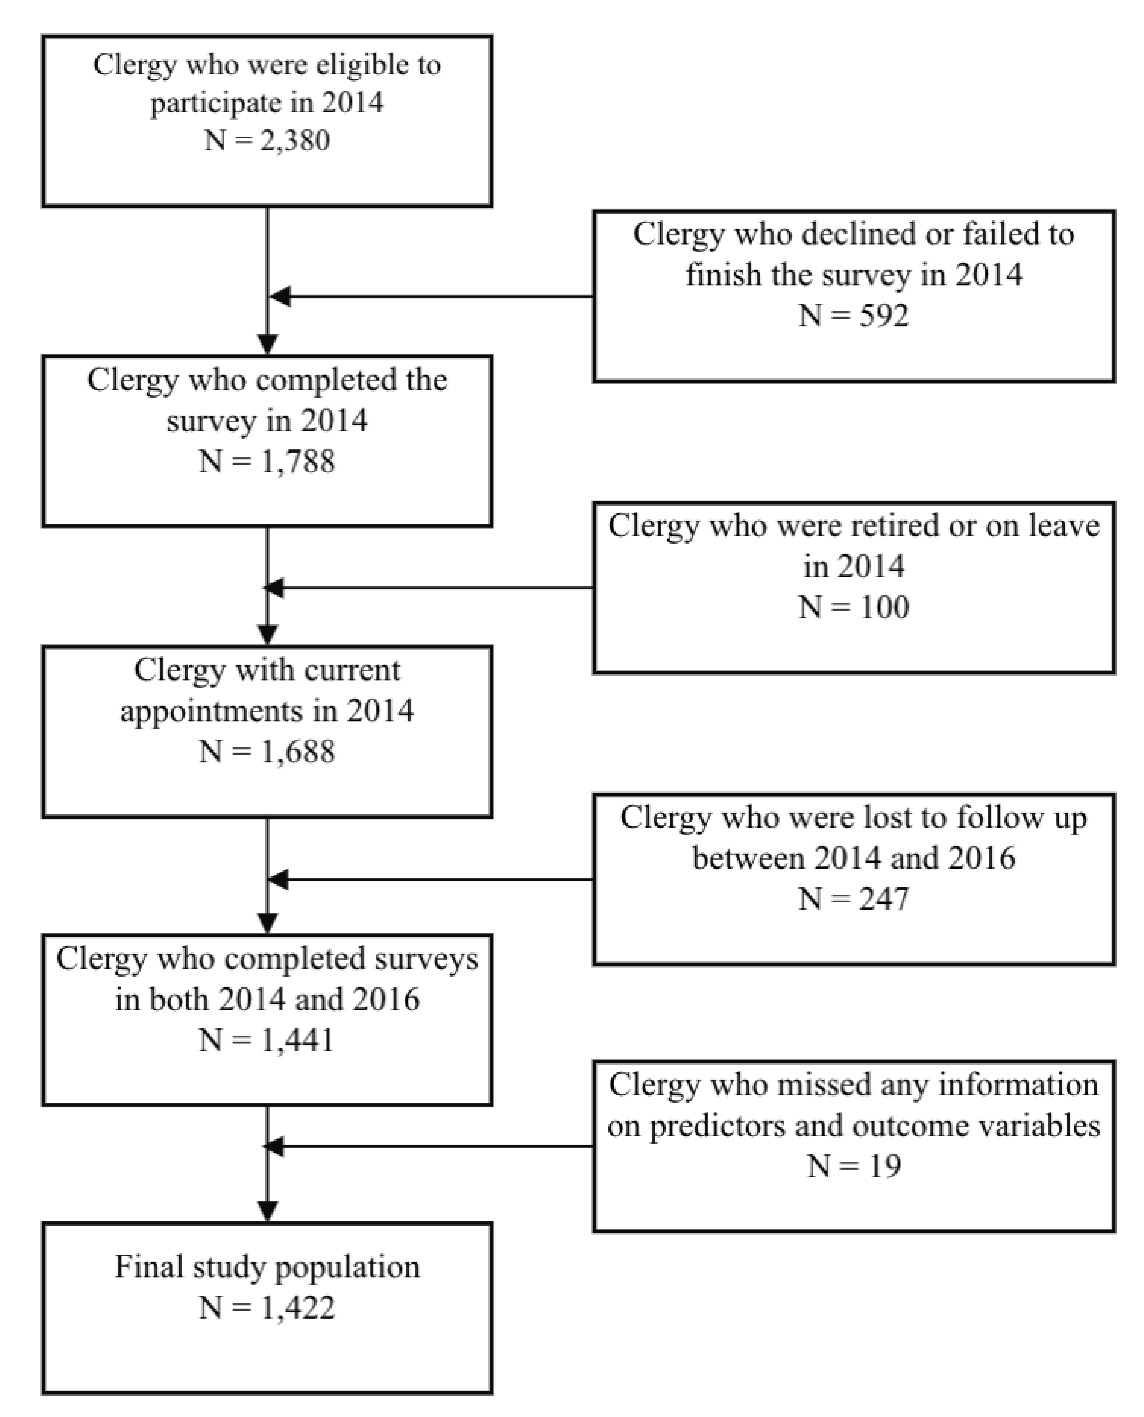
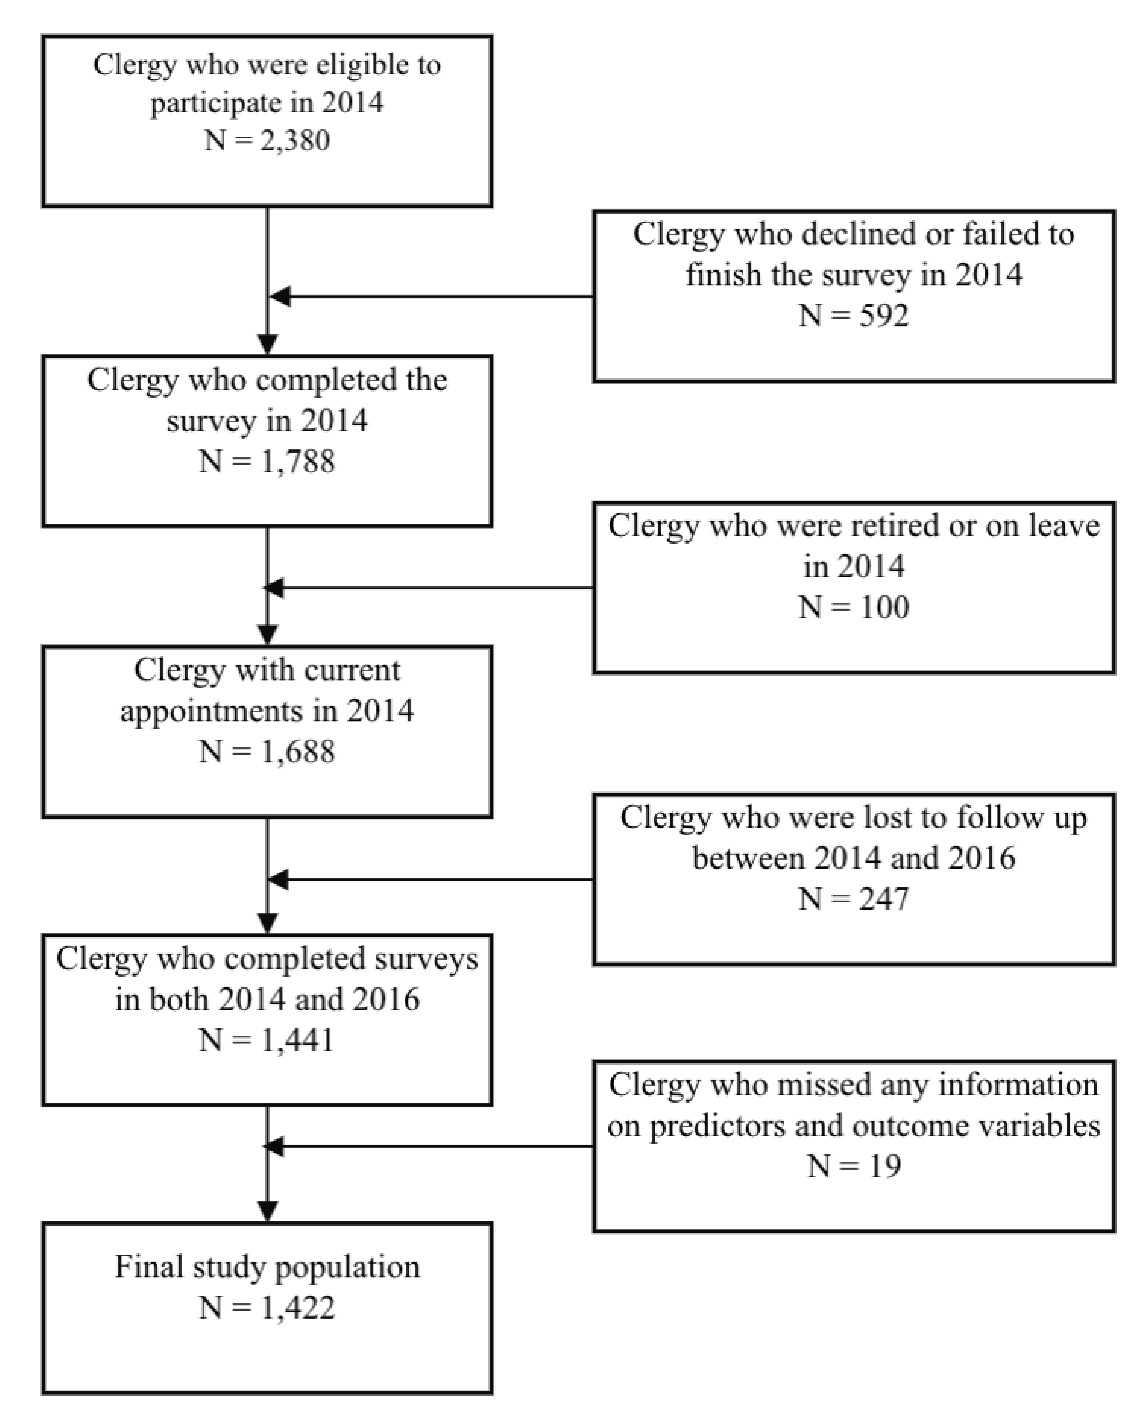
In 2014, 1788 of 2380 eligible North Carolina UMC clergy participated (78.4% response rate). Retired or “on-leave” clergy were excluded (n = 100). Furthermore, only participants who completed both the 2014 and 2016 waves were included, excluding first-time 2016 respondents and those who were lost to follow-up (n = 247). After further exclusions for missing BMI, depressive symptoms, or PF (n = 19), the final analytic sample was 1422 clergy (Figure 1).
Procedures
All participants provided informed consent before participation. Data collection was conducted by Westat, a social science research firm. In 2014, eligible clergy received a survey introductory letter and a $25 prepaid incentive. Surveys were administered online, with multiple reminders sent. Paper surveys were offered upon request in 2014; the 2016 wave was conducted entirely online. The study received ethical approval from the Duke University Campus Institutional Review Board and the Westat Institutional Review Board (IRB-approved protocol # 2017-1197).
Measures
Body mass index (BMI). BMI was calculated from self-reported height (inches) and weight (pounds), which were converted into metric units (kg/m2). Participants were classified as underweight (< 18.5 kg/m2), normal weight (18.5–24.9 kg/m2), overweight (25–29.9 kg/m2), or obese (≥ 30 kg/m2) per CDC guidelines,54 and grouped into non-obese (underweight, normal weight, overweight) or obese (≥ 30 kg/m2) categories for analysis.
Depressive symptoms. Depressive symptoms were measured using the 9-item Patient Health Questionnaire (PHQ-9), a validated measure of depression severity.55,56 Participants rated symptom frequency over the past two weeks using a 4-point Likert scale (0 = not at all, 1 = several days, 2 = more than half the days, 3 = nearly every day). Total scores ranged from 0–27, with ≥ 10 indicating elevated depressive symptoms.56
Physical functioning. PF was measured using the Medical Outcomes Study Short Form-12 version 1 (SF-12v1), a validated HRQoL measure that has demonstrated strong reliability, internal consistency, and construct validity in diverse populations.57,58 The Physical Health Composite Score was calculated using standard scoring guidelines. The United States average score is 50, and higher scores indicate better PF.57
Covariates. Baseline sociodemographic and lifestyle covariates include age, gender, race, education, marital status, physical activity, financial stress, and average weekly work hours (all self-reported). Education was grouped into “less than a master’s degree,” “master’s degree,” and “doctoral degree,” given that only a small percentage of participants attained less than a bachelor’s degree. Physical activity was dichotomized based on whether participants met the CDC-recommended ≥ 150 minutes of moderate-to-intense exercise per week. Financial stress was assessed on a 5-point scale (1 = not at all stressed, 5 = extremely stressed).
Analysis
Continuous variables were tested for normality using the Shapiro-Wilk test. Descriptive analyses included means (SD) for normally distributed variables, medians (IQR) for skewed data, and frequencies (%) for categorical variables. Logistic regression was conducted to examine cross-sectional associations between obesity and elevated depressive symptoms at baseline (2014), reported as odds ratios (OR) with 95% confidence intervals (CI).
Ordinary least squares (OLS) multiple regression assessed independent and joint prospective associations of baseline (2014) obesity, baseline depressive symptoms, and subsequent (2016) PF. A second OLS regression model adjusted for baseline sociodemographics and the lifestyle covariates described above to estimate their prospective associations with PF assessed in 2016, ensuring a temporal relationship between exposure and outcome. Baseline (2014) physical functioning was included as a covariate in all regression models, allowing us to account for prior levels of PF and thereby assess changes in PF between 2014 and 2016 instead of limiting the analysis to cross-sectional associations.
Interaction terms between obesity and elevated depressive symptoms were added to both unadjusted and adjusted models. The regression coefficient (β) for the interaction term quantified whether the combined association of obesity and depressive symptoms on 2016 PF was greater (synergistic, β>0), less (antagonistic, β<0), or equal (β = 0) to the sum of their independent associations.
Among 1676 participants with a PF score in 2014, 245 (14.6%) lacked a PF score in 2016. In a sensitivity analysis, we imputed missing values using multiple imputation by chained equations under the missing at random assumption. We generated ten imputed datasets (M = 10) with 10 iterations, using models appropriate to variable type and including the PF score in 2014, appointment role, and all adjusted covariates as predictors. Estimates from subsequent analyses were combined using Rubin’s rules. Statistical significance was set at P < .05. All analyses were conducted using Stata 17.0 (Stata Corp, College Station, TX, USA).
Results
Sample Characteristics
Table 1 presents participant characteristics (N = 1422) by obesity status. The sample was predominantly male (69.9%), White (91.8%), and married/living with a romantic partner (87.1%). Most had a master’s degree or higher (82.6%), served as lead/solo pastors (86.3%), and worked a median of 50.0 hours/week (IQR: 40.0–57.0). Nearly three-quarters of the sample (73.8%) met the CDC’s weekly exercise recommendations, with a median PF score of 53.78 (IQR: 48.6–55.9) and a median BMI of 28.35 (IQR: 24.9–32.9). Overall, 39.5% of participants were obese. Compared with their non-obese counterparts, participants with obesity reported lower PF scores, longer work hours, and had a higher likelihood of elevated depression symptoms (OR: 2.66; 95% CI: 1.76–4.02).
Independent and Joint Effects of Obesity and Depression on Physical Functioning
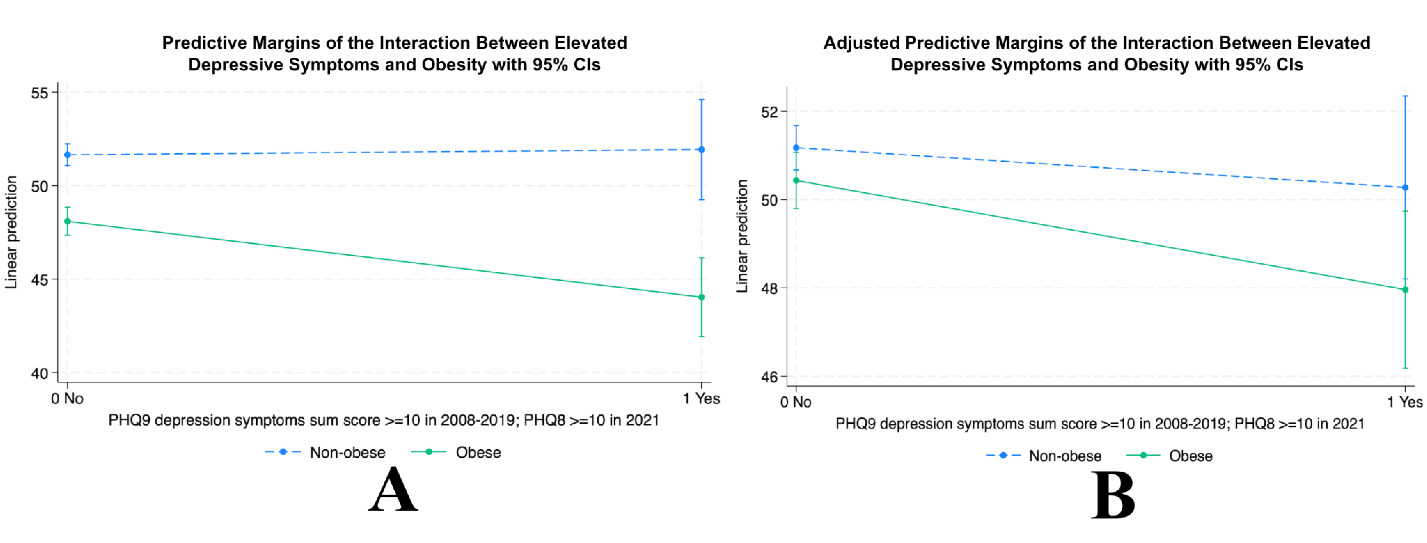
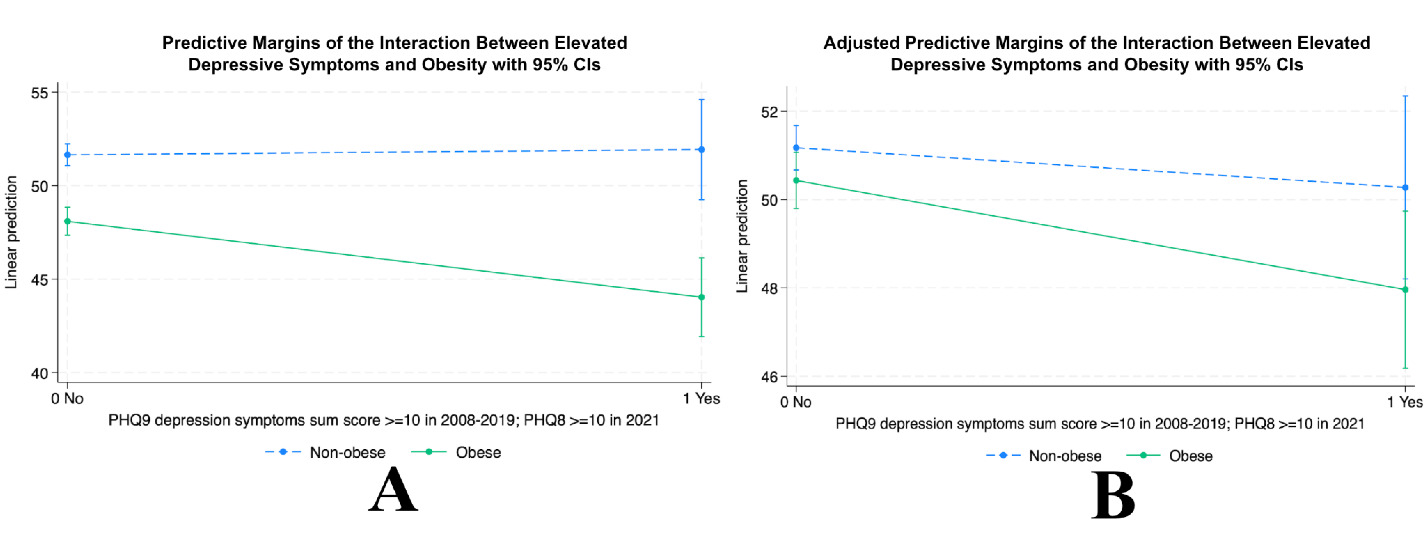
OLS multiple regression analysis (Table 2) revealed that obesity (β = –0.93; 95% CI: –1.73, –0.13) and elevated depressive symptoms (β = –1.90; 95% CI: –3.32, –0.47) were independently associated with lower PF scores in 2016. As shown in Table 2, we found a joint association of obesity and depressive symptoms (β = –4.34; 95% CI: –7.87, –0.81) in the crude model; however, the joint association is no longer significant after full adjustment. In the sensitivity analyses (Table 3 and Figure 2), the interaction coefficient is attenuated, although the directions of associations remain consistent, indicating that the findings are robust to missing data assumptions.
Discussion
Research Findings
Obesity and elevated depressive symptoms in 2014 were independently and prospectively associated with lower PF in 2016. While their co-occurrence was associated with greater PF decline than expected from each condition alone in unadjusted models, once accounting for baseline PF, the finding was attenuated, suggesting an underlying functional vulnerability in this clergy population rather than a synergistic effect over time. By leveraging a longitudinal design, this study expands upon prior research and points to the need to consider both obesity and depression in the prevention of PF decline.
Previous studies have linked depression to lower PF in the general population,59 patients with chronic illnesses,60 and older adults.61,62 Clergy may be particularly vulnerable to PF decline given occupational demands such as persistent role expectations and emotional labor, which can impede consistent engagement in physical self-care.63 Obesity has also been consistently associated with lower PF, though many studies focus on elderly populations and examine obesity apart from mental health factors.34,64,65 In our sample (mean age = 58), clergy experiencing co-occurring obesity and depression had lower PF at follow-up compared to their non-obese, non-depressed counterparts.
Although research on this topic remains limited, a prior cross-sectional Dutch study (N = 89,332), found that obesity, abdominal obesity, and major depression/anxiety independently worsened HRQoL (consistent with our findings); in the Dutch study, these conditions’ co-occurrence was associated cross-sectionally with lower HRQoL than either condition alone.66 The longitudinal data from our study did not find a significant interaction. More longitudinal studies are needed.
Implications for Practice
Holistic interventions integrating weight management, mental health support, and lifestyle modifications are essential for mitigating PF decline.67–70 Health care providers should screen for both obesity and depression, particularly in populations with heightened occupational stressors. Addressing stigma around these conditions within the clergy community could encourage help-seeking behaviors and increase engagement with health-promoting activities.71,72
Beyond screening, high obesity-depression comorbidity in clergy suggests a population in which preventative and resilience-building interventions may be especially relevant. Positive mental health constructs (e.g., positive affect, sense of purpose, social connectedness) have been associated with lower incidence of depressive disorders in population research,73 and longitudinal evidence in clergy suggests that sustained positive mental health may buffer subsequent mental health decline during stressful conditions.74 Given reciprocal associations between obesity and depression,75 interventions that reduce depressive symptoms may also yield secondary benefits for weight-related outcomes.
Further, clergy-tailored wellness programs implemented within faith-based settings may improve feasibility and participation. For example, the Faith, Activity, and Nutrition (FAN) program is a community-based congregation-wide intervention that improved physical activity and nutrition behaviors among clergy and congregants.76 Adapting such programs to incorporate depression identification and mental health supports may be particularly beneficial for clergy experiencing co-occurring risk. Moreover, previously successful clergy-specific trials (e.g., Spirited Life, Selah) support the feasibility of integrated health interventions combining weight-related behavioral change, lifestyle change, and stress management, especially when they allow participant choice and are designed to accommodate the unique vocational demands of ministry.77–80
Future Research
Future studies should further explore mechanisms/mediators underlying obesity-depression-PF relationships, including inflammatory activity, stress-related biomarkers, and other physiological pathways. Research should also evaluate how clergy-specific factors (e.g., occupational demands, spiritual well-being, ministry social networks) shape risk and intervention responsiveness to guide targeted, scalable strategies.
Study Strengths and Limitations
This study’s two-year longitudinal design strengthens our ability to assess prospective associations by ensuring temporal ordering between exposures and outcomes, although these associations over time could be due to other variables. While high response rates can be difficult to achieve with depressed populations, this study had response rates of 73%–75% per wave within an occupational cohort of clergy that is larger than most studies of religious professionals. Attrition between 2014 and 2016 was 14.4%. Findings using data imputation were in the same direction but smaller, suggesting that future studies should account for missing data.
Our findings may have limited generalizability when considering how UMC clergy differ from the general population in several key demographics. For example, 91.2% of our sample possessed at least a bachelor’s degree, compared to 37.9% and 34.7% of adults aged 25 years and older in the United States81 and North Carolina,50 respectively. Nevertheless, the study’s findings may provide valuable insights for designing interventions for other occupational populations experiencing similar stressors.
Further, self-reported data (for obesity, elevated depressive symptoms, PF, and subjective covariates) introduces potential misclassification errors. In particular, self-reported height and weight tend to be underestimated, resulting in potential BMI misclassifications.82 Additionally, utilizing the cutoff score of 10 on the PHQ-9 to classify elevated depressive symptoms has been validated, but, as with any screener, will still result in misclassification of some participants.
Additionally, HRQoL was measured using the SF-12v1 (due to CHILS’ initially established methods from 2008) rather than the updated SF-12v2. While SF-12v1 has internal consistency of 0.88–0.89 for the physical component summary,83 which is highly similar to that of the SF-12v2, the SF-12v2 has overall higher concurrent and construct validity.84 Accordingly, future studies may benefit from employing newer measures or incorporating direct, objective PF metrics (e.g., wearable fitness trackers, measuring knee extensor or handgrip strength).85
Finally, this study’s data were collected from 2014–2016, nearly a decade prior to the present analysis. We relied on these waves because CHILS’ 2016 wave was the last to include the SF-12 measure of physical functioning. Although the prevalences of obesity and depressive symptoms among clergy may have shifted since 2016, our study focuses on the prospective associations between these conditions and physical functioning. Prior longitudinal studies have demonstrated that relationships between obesity, depression, and physical health outcomes tend to persist over time,86–89 supporting the notion that while absolute prevalence may shift over years, the directional and interactive associations are likely to remain relevant in contemporary populations.
Conclusion
As obesity and depression continue to rise, particularly in high-stress occupational populations such as clergy, their compounding impacts on PF and long-term well-being demand greater attention. By leveraging longitudinal data, we provide evidence that these conditions interact over time to accelerate PF decline, reinforcing the urgent need for sustainable, integrated initiatives that support both mental and physical resilience in clergy and similar at-risk populations. Addressing these interconnected health challenges is not only vital for individual well-being, but also for maintaining the broader social and spiritual leadership that clergy provide to their communities.
Acknowledgments
We thank the Westat data collection team, including Crystal MacAllum and Gail Thomas. This study was funded by a grant from the Rural Church Area of The Duke Endowment.
Declaration of Interests
The authors have no conflicts of interest to report.
Correspondence
Address correspondence to Achintya Inumarty (inumarty@bu.edu).