Like almost every area in the United States, North Carolina has been severely impacted by the opioid epidemic. Since 2000, the number of drug overdose deaths has increased more than 5.5 times, from 537 deaths to 2975 deaths; the death rate increased from 6.5 per 100,000 people to 28.4 per 100,000 people.1 In 2018, the National Institute on Drug Abuse (NIDA) estimated that 79% of all drug overdose deaths in North Carolina involved an opioid.2 There are many types of opioids, some of which have an established role in medicinal treatment in the United States (e.g., morphine, codeine, and their analogues). These drugs can be prescribed by health care providers and are most commonly prescribed to treat acute and chronic pain.3 From 2006 to 2012, the number of prescriptions for opioids increased from 72.4 prescriptions per 100 Americans to 81.3 prescriptions per 100 Americans.4 In North Carolina, the height of opioid prescriptions was in 2015, with 22.1% of residents receiving a prescription; that rate has since declined to 13.7% in 2020.1 In 2016, in response to rising concern about opioid-related risks, the Centers for Disease Control and Prevention (CDC) published guidelines that included 12 recommendations aimed at more comprehensively treating chronic pain patients and reducing opioid-related harm.3
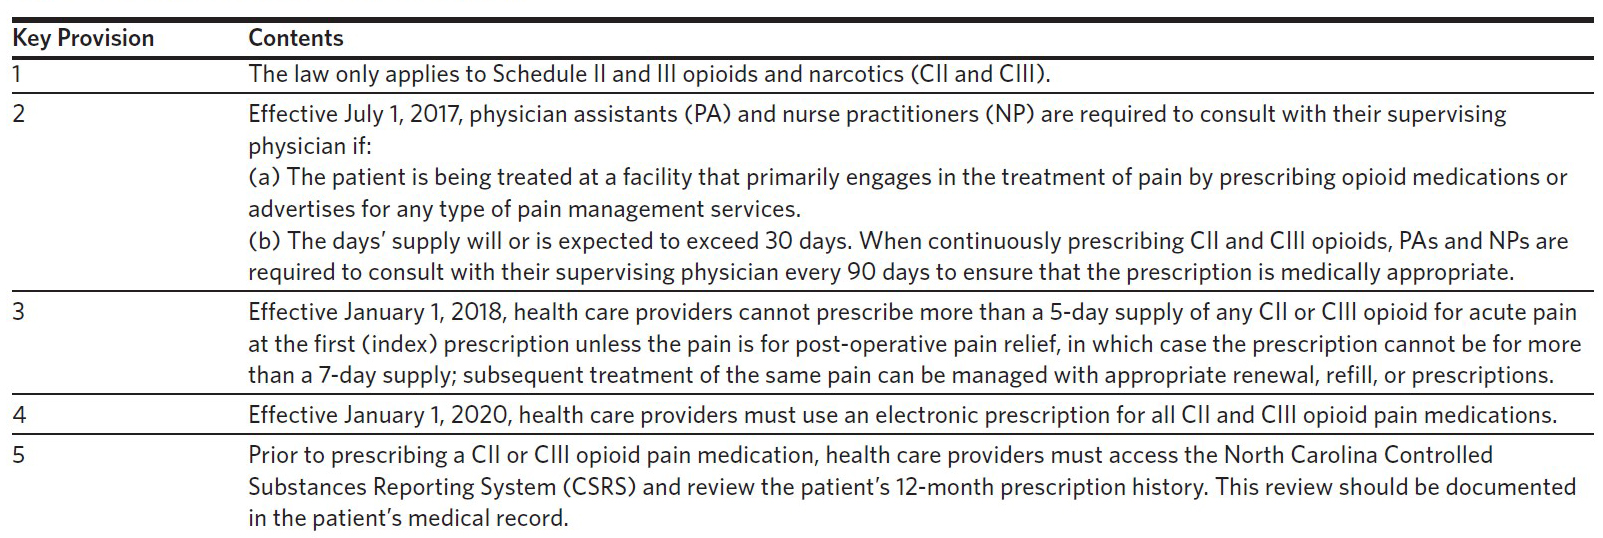
Like other states, North Carolina has actively taken steps to curb the drug overdose death rate at the provider, patient, and legislative levels.5–7 In 2017, Governor Roy Cooper signed the Strengthen Opioid Misuse Prevention (STOP) Act.7 The STOP Act was intended to decrease the supply of unused, misused, and diverted opioids circulating in North Carolina; reduce “provider shopping” to receive an opioid prescription; and direct providers to use tools and resources to prevent inappropriate prescribing.7 There are five key provisions in the law that are important for health care providers to note (Table 1). The STOP ACT, as noted in key provision 1, only applies to Schedule II and Schedule III opioids and narcotics (CII and CIII). According to the United States Drug Enforcement Administration (DEA), a Schedule II drug has a high potential for abuse, with use potentially leading to severe psychological or physical dependence. A Schedule III drug has a moderate to low potential for psychological or physical dependence, registering as less potentially impactful than a Schedule II drug but with a higher potential than a Schedule IV drug.8
.png)
Prior studies have suggested that the NC STOP Act has led to reductions in the number of opioid prescriptions.9–11 These prior studies have been limited to only one health system, one type of provider, or were conducted a few months after implementation of the act. Hughes and colleagues found an overall reduction in opioid deaths in the two years after NC STOP Act was enacted, but they did not account for prescribing patterns.12 To date and to our knowledge, there have been no population-level examinations of the effectiveness of the bill. To fully understand the effect of the policy, a longer timeframe and statewide investigation needs to be conducted. Medicare is one of the largest payers of prescription drugs in the United States and represents one opportunity to study the effect of policy on medication utilization. Of particular concern, even though the first prescribed (i.e., index) CII or CIII opioid pain medication can only be for a five- or seven-day supply, subsequent refills and renewals are not restricted to a day-supply limitation.7 Therefore, the objectives of this study are to: 1) quantify the dispensing and days’ supply of opioid prescriptions prior to and after the NC STOP Act went into effect among Medicare Part D beneficiaries; and 2) evaluate whether the NC STOP Act is associated with reductions in opioid prescriptions’ days’ supply among Medicare Part D beneficiaries.
Methods
This was a retrospective, observational study of the Medicare Part D Public Use File (PUF) using data from 2013 through 2019.13 These datasets include all the available PUF data. These datasets are at the provider-drug level and contain all prescription drugs paid for by Part D, including traditional Medicare and Medicare Advantage claims. This study was approved by the Wake Forest School of Medicine Institutional Review Board (IRB).
The CMS Chronic Conditions Data Warehouse is the primary source for the PUF data used in this study. These data contain all Medicare Part D final claim adjustments for those who are enrolled in the Part D program. The data contain information on the provider, drug name (trade and generic), number of aggregated claims and day supply, and total drug costs. For providers who have fewer than 10 patients who are Medicare enrollees, the number of enrollees is masked to protect privacy. These datasets only contain information about Medicare Part D enrollees, including traditional, standalone prescription drug plans as well as Medicare Advantage Prescription Drug Plans. A more in-depth explanation about the methodology can be found at the Centers for Medicare and Medicaid Services website.13
Participants
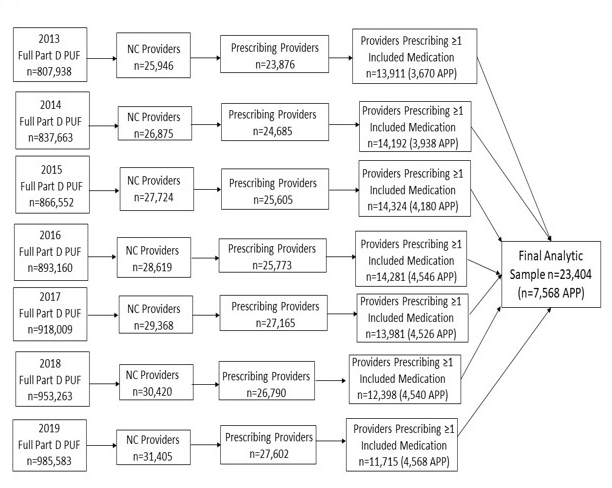
Figure 1 presents the flow chart for the provider cohort selection. First, we excluded all providers who were not affiliated with North Carolina. Second, we excluded types of health care professionals who are not authorized to prescribe any medications. We then restricted the dataset to five CII and CIII opioid prescriptions: 1) hydrocodone/acetaminophen, 2) oxycodone HCl/acetaminophen, 3) oxycodone HCl, 4) fentanyl, and 5) acetaminophen with codeine. These drugs were included because they were previously identified as some of the most prevalently prescribed opioids nationally and in North Carolina.14 We also included tramadol as a control to examine whether providers would switch from the CII and CIII opioids due to the legislation. As stated, the STOP Act provisions only affect CII and CIII opioid medication, i.e., tramadol was not affected by the STOP Act. We hypothesized that as prescriptions for the CII and CIII opioids decreased, we would see increases in the number of prescriptions for tramadol. This procedure was conducted on each dataset separately and was then merged to create a final analytic dataset (N = 23,404). We also created a dataset just for physician assistants (PAs) and nurse practitioners NPs) to assess the impact of the legislation on their prescribing.

Measures
We created a dichotomous variable identifying whether the prescribing provider was a PA or NP (collectively known as an advanced practice provider [APP], Yes = 1) or a physician (APP, No = 0). We also created a dichotomous variable indicating whether the provider was a PA (Yes = 1) or not (NP, No = 0) for just the PA and NP datasets. The year of the prescription was a categorical variable. The claims for each medication are aggregated at the yearly level. We created a variable indicating the number of population-adjusted claims for each included medication per-provider by dividing the total number of claims for each drug, which was subsequently divided by the Medicare Part D population in North Carolina for each year.15 We multiplied the answer by 100,000 to obtain a population-adjusted rate of claims. We then created an average day supply for each medication by dividing the total day supply by the total claim count. Next, we created a dichotomous variable for primary care physicians that included the following specialty descriptions contained within the dataset: 1) Family Medicine/Practice, 2) General Practice, 3) Geriatric Medicine, and 4) Internal Medicine. We also created a dichotomous variable indicating the time after the policy went into effect (Yes, 2018–2019 = 1) and the time prior to the policy going into effect (No, 2013– 2017 = 0).
Statistical Analysis
We used SAS v9.4 (Cary, North Carolina) to analyze the data. First, we presented the number of yearly population-adjusted claims and average days’ supply for the combined CII and CIII included medications and tramadol separately between 2013 and 2019 for all providers, and then for APPs separately. We then created multivariable Poisson regression models to examine the relationship between when the days’ supply limitation went into effect (policy) with the population-adjusted number of CII and CIII claims, as well as the average days’ supply, controlling for whether the provider was an APP. To analyze the relationship of the APP consultation policy on CII and CIII opioid prescribing, we created a multivariable Poisson regression model using the policy period variable as the independent variable, controlling for whether the provider was a PA. We then used the same model parameters examining only tramadol prescriptions. The Poisson regression models all used a log-link and were two-sided with an alpha set at < .05 to indicate statistical significance. All regression model results are presented as rate ratios (RR) with 95% confidence intervals (CI).
Results
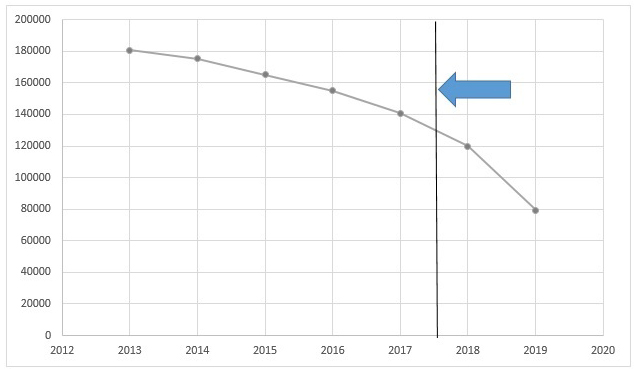
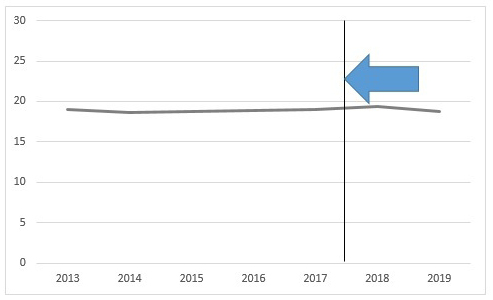
Figure 2 presents the yearly total population-adjusted claims for all providers. For all the included medications, there were a total of 17,159,679 claims in North Carolina during 2013–2019, with a mean days’ supply of 19.59 (SD = 10.06). In 2013, there were population-adjusted 180,565.2/100,000 claims for the included CII and CIII opioids, which decreased to 79,329.12/100,000 claims in 2019. For the included CII and CIII medications alone, there were a total of 13,321,503 claims with a mean days’ supply of 18.91 (SD = 10.14). Figure 3 presents the yearly mean days’ supply for the included CII and CIII medications. Approximately 1 in every 3 CII and CIII prescriptions (N = 5,023,643; 29.28%) were from primary care physicians. PAs constituted 15.07% (N = 2,585,474) of the total number of CII and CIII prescriptions, while NPs constituted 11.24% (N = 1,928,103). Per provider, the population-adjusted number of claims from PAs and NPs was 5.78/100,000, compared to 5.21/100,000 from physicians. The mean days’ supply from PAs and NPs was also higher (19.02 days, SD = 9.70) than from physicians (18.86 days, SD = 10.34).


There was a total of 3,838,176 claims with a mean days’ supply of 21.75 days (SD = 9.45) for tramadol over the included timeframe. Primary care physicians prescribed a total of 3314 prescriptions for tramadol (0.08%) while PAs prescribed 1404 (0.04%) and NPs prescribed 880 (0.02%). In 2013, the population-adjusted number of claims for tramadol was 45,327.33/100,000. In 2019, the population-adjusted number of claims was 35,635.53/100,000. The number of per-provider, population-adjusted claims for tramadol was higher for physicians (5.60/100,000; SD = 6.12) than for PAs and NPs (3.59/100,000; SD = 3.67). The mean days’ supply for physicians was 22.60 days (SD = 9.53), while the mean days’ supply for PAs and NPs was 20.11 (SD = 9.07).
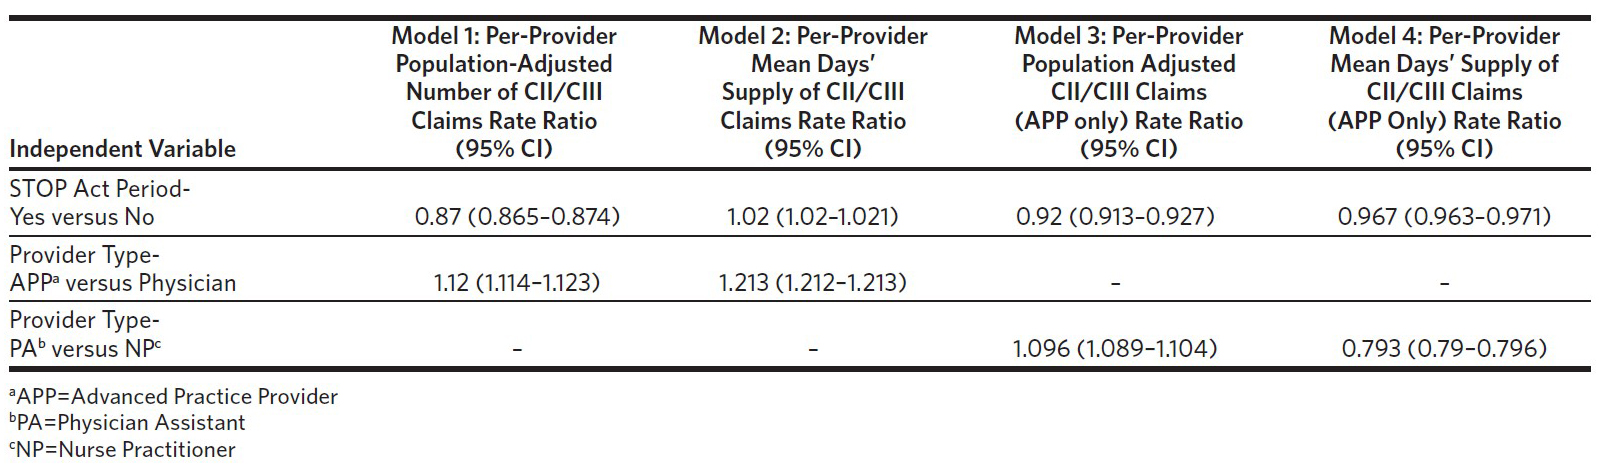
Table 2 presents the results of the multivariable Poisson regression models examining CII and CIII claims and days’ supply. A multivariable Poisson regression model examined the relationship between the per-provider population-adjusted number of CII and CIII claims and the NC STOP Act policy going into effect, controlling for provider type (APP = 1, physician = 0). This regression model found that, controlling for provider type, the NC STOP Act was associated with a reduction in the per-provider population-adjusted number of CII and CIII claims (RR = 0.87; 95% CI = 0.865–0.874). This model also found that, controlling for the NC STOP Act, PAs and NPs prescribed a greater per-provider, population-adjusted number of CII and CIII claims compared to physicians (RR = 1.12; 95% CI = 1.114–1.123).

A multivariable Poisson regression model examined the relationship between per-provider mean days’ supply of CII and CIII claims and the NC STOP Act policy going into effect, controlling for provider type (Table 1). This model found that the NC STOP Act period was associated with an increase in the mean days’ supply (RR = 1.02; 95% CI = 1.02–1.021), controlling for provider type. Controlling for the NC STOP Act, this model also found that PAs and NPs prescribed a longer mean days’ supply than physicians (RR = 1.213; 95% CI = 1.212–1.213).
Examining only PA and NP CII and CIII prescribing, we conducted a multivariable Poisson regression model examining the relationship between the per-provider population-adjusted number of claims and the NC STOP Act period, controlling for provider type (Table 2). We found that the NC STOP Act period was associated with fewer per-provider, population-adjusted claims compared to before the NC STOP Act (RR = 0.92; 95% CI = 0.913–0.927). The model also found that, controlling for the policy period, PAs prescribed more per-provider, population-adjusted CII and CIII claims than NPs (RR = 1.096; 95% CI = 1.089–1.104). Likewise, for per-provider mean days’ supply, the multivariable Poisson regression model indicated the NC STOP Act time period was associated with fewer mean days’ supply of CII and CIII opioids (RR = 0.967; 95% CI = 0.963– 0.971), controlling for provider type. The model also found that, controlling for the policy period, PAs prescribed a shorter mean days’ supply for CII and CIII opioids than NPs (RR = 0.793; 95% CI = 0.79–0.796).
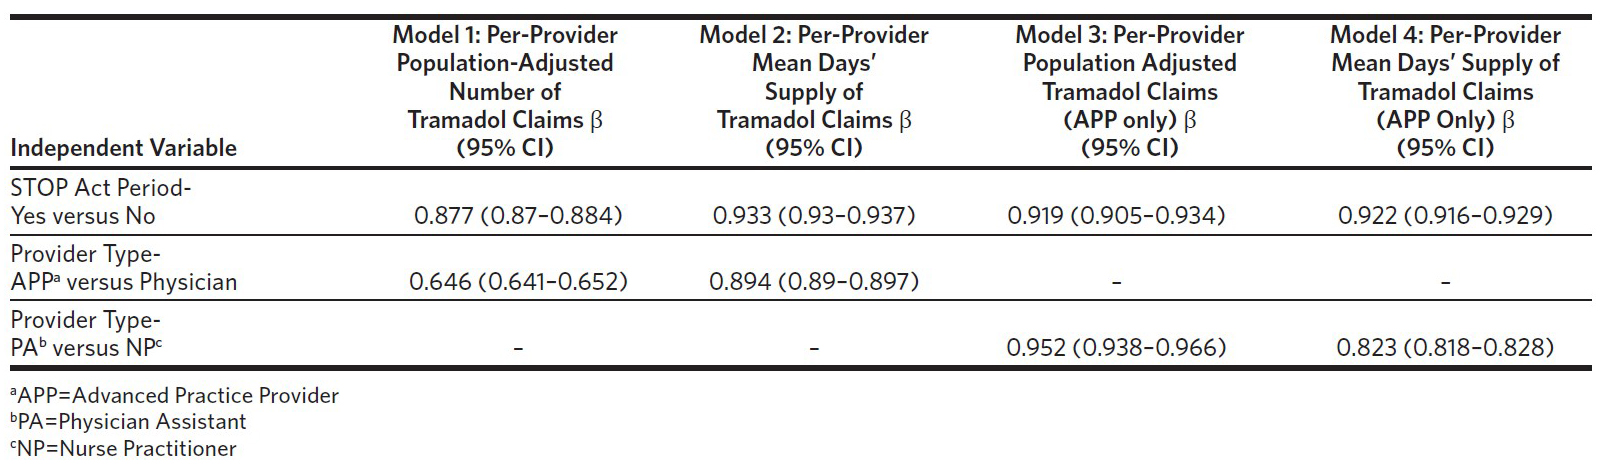
Table 3 presents the results of the multivariable Poisson regression models examining tramadol prescribing. We examined the relationship between the effect of the NC STOP Act policy and tramadol prescribing using a multivariable Poisson regression model, controlling for whether the provider was an APP. Controlling for provider type, we found that the NC STOP Act period was associated with a decrease in the number of per-provider population-adjusted tramadol claims (RR = 0.877; 95% CI = 0.87–0.884). This model also found that APPs prescribed fewer per-provider population-adjusted claims for tramadol than physicians (RR = 0.646; 95% CI = 0.641–0.652). We also created a multivariable Poisson regression model examining the relationship between mean days’ supply and the NC STOP Act period, controlling for whether the provider was an APP. This model found that, controlling for APP status, the NC STOP Act period was associated with fewer mean days’ supply as compared to before the NC STOP Act period (RR = 0.933; 95% CI = 0.93–0.937). This model also found that APPs prescribed a lower mean days’ supply for tramadol than physicians (RR = 0.894; 95% CI = 0.89–0.897), controlling for the NC STOP Act period.

We also examined the relationship between PA and NP tramadol prescribing practices and the NC STOP Act period using multivariable Poisson regression models, controlling for provider type (PA = 1, NP = 0) (Table 3). We found that the NC STOP Act period was associated with a lower per-provider, population-adjusted number of tramadol claims compared to the time prior to the NC STOP Act (RR = 0.919; 95% CI = 0.905–0.934), controlling for provider type. We also found that the NC STOP Act period was associated with a lower per-provider mean days’ supply of tramadol claims compared to the time prior to the NC STOP Act (RR = 0.922; 95% CI = 0.916–0.929), controlling for provider type. Finally, compared to NPs, the two models found that PAs had fewer per-provider, population-adjusted tramadol claims than NPs (RR = 0.952; 95% CI = 0.938–0.966), and lower per-provider mean days’ supply (RR = 0.823; 95% CI = 0.818–0.828), controlling for the NC STOP Act period.
Discussion
We found that since the implementation of the NC STOP Act, there has been an observable decline in the number of prescription opioids dispensed and paid for by Medicare Part D. While the population-adjusted number of prescribed opioid claims has consistently been decreasing since 2013, the trend seems to have accelerated since 2017–2018, the same years that many provisions of the STOP Act went into effect. While the exact contribution of the STOP Act cannot be ascertained in this dataset due to the data collected and study design, it appears that the STOP Act may have contributed to reducing the supply of certain CII and CIII opioids in North Carolina.
We also found that PAs and NPs have decreased their opioid prescriptions since the STOP Act was signed. Likewise with physicians, it is impossible to ascertain how much of the reduction in population-adjusted claims is due solely to the STOP Act. It is important to also consider other legislation, such as the Comprehensive Addiction and Recovery Act (CARA) of 2016, as well as the CDC opioid guidelines, which may have differentially impacted PA and NP opioid prescribing during the studied timeframe compared with physicians.3,16 The CARA of 2016 allowed PAs and NPs to prescribe medication-assisted treatment (MAT) for those with opioid use disorder (OUD) after completing 24 hours of instruction. The Drug Addiction Treatment Act (DATA Act) of 2000 only applied to physicians, which may have impacted their opioid prescribing before that of their PA and NP colleagues.17 Whatever the cause, there has been a flurry of guidelines, policies, and legislation, along with social media, popular media, and traditional news media, all of which has contributed to opioid prescribing practices.
Our results are consistent with other studies that show a decrease in the number of opioid prescriptions over time and in response to the STOP Act.9–11 In a commercially insured population, Maierhofer and colleagues found that the introduction of the STOP Act was associated with decreases in incident opioid prescriptions, mean daily morphine milli-equivalents, and days’ supply, which is consistent with our findings.10 It should be noted that our claims sample, which was from Medicare, consisted of older and sicker patients than the sample used by Maierhofer and colleagues. The same pattern of findings lends credence to the validity of both studies’ findings.
While there has been a focus on reducing the supply of prescription opioids, there have also been unintended consequences that may drive patients toward illicit opioids, such as heroin and illicit fentanyl. For instance, data are clear that many people who use heroin started using prescription opioids first.18 According to McEwen and Prakken, the North Carolina Medical Board (NCMB) receives numerous complaints about physicians abruptly discharging patients or refusing to engage in pain management at all.19 Providers need to be aware of unintended consequences that may force patients to seek illicit opioids, increasing the opioid-related death rate. As McEwen and Prakken note, “As access to prescription opioids has become harder, more patients seek relief on the street, accessing both prescription opioids and much deadlier illicit opioids”.19 It is also well established that stigma toward those with OUD from providers also contributes to negative health outcomes for this population.20–22 It is essential to reduce the supply of prescription opioids and ensure that those with OUD receive evidence-based treatment. At the same time, more focus needs to be placed on educating providers about how to manage these complex patients who present with numerous medical comorbidities and psychiatric diseases, as well as poor social determinants of health that may impact their access to and adherence to treatment.
Limitations
This analysis was limited to one state, so the results may not be generalizable to the policies of other states. As described above, this was an observational study using yearly aggregated claims data, so we are not able to identify how certain provisions of the STOP Act that were implemented mid-year (e.g., PA and NP consultation with their physician colleagues) impacted prescribing practices. This limitation is somewhat mitigated because the days’ supply limit provision went into effect on January 1, 2018, making it easier to identify the effect of that provision on the yearly aggregated data. However, using other sources of data that are patient-level, longitudinal, and include within-year timepoints (i.e., months) would allow for more sophisticated quasi-experimental designs, such as an interrupted time-series design that would have more power for causal inference. We believe, however, that these datasets are an excellent method for conducting initial analyses of national and state-based drug legislation.
Another limitation is the possibility of Type I errors, which are common for all secondary claims-based datasets due to the large sample sizes. A Type I error occurs when a statistically significant association is found, but there is not actually an association in real life. Type I errors are common when there is a large number of observations, which is typical in claims-based data. We found that PAs and NPs wrote more population-adjusted claims with longer days’ supply for CII or CIII opioids than physicians, but the magnitude of the difference was small (PA/NP 5.78 claims/100,000 [19.02 days] versus MD/DO 5.21 claims/100,000 [18.86 days]). The numbers indicate that the statistical significance may be due to the large sample size.
As stated above, there have been many potential influences on prescribing behavior in addition to state and federal regulation, such as social media, news media, and other influential factors. We also selected only a few opioid medications to analyze, and prescribing behaviors for other opioids may be different than for those included in this study. Finally, due to data limitations regarding PAs and NPs, it is not currently possible in any nationally representative dataset (e.g., Medicare Fee-for-Service or National Ambulatory Medical Care Survey [NAMCS]) to identify the PA specialty, which hinders the conclusions that can be drawn from this study. We are also not able to risk-adjust for patient mix between physicians, PAs, and NPs, which hinders some of the conclusions that may be drawn from this analysis.
Conclusion
This study longitudinally assessed the impact of the NC STOP Act on claims for certain CII or CIII opioids and tramadol. To our knowledge, it is the first study to examine the impact of the STOP Act on a population-wide level, as well as the first to examine how the STOP Act impacted tramadol claims. We found that there was a general downward trend for claims for these drugs but that the trend accelerated after the policy went into effect. We also found that the days’ supply for these drugs was consistent over time, with mild fluctuations, indicating that patient-level data are needed to study the effect of the policy on this outcome.
Acknowledgments
No funding was used to conduct this study. The authors report no conflicts of interest. The authors gratefully acknowledge the biostatistical consulting services of the Wake Forest University School of Medicine Clinical and Translational Science Institute (CTSI), funded by the National Center for Advancing Translational Sciences (NCATS), National Institutes of Health, through Grant Award Number UL1TR001420.