Food insecurity (FI) involves limited access to adequate, safe, and nutritious foods to maintain a healthy life due to poverty, housing instability, systematic racism, chronic health conditions, and many other factors.1–3 High-risk groups for food insecurity include underrepresented groups (i.e., people of color) and people with type 2 diabetes (T2D), a condition that disproportionately affects underrepresented groups.4,5 Food insecurity prevalence in the United States typically hovers around 10% but the prevalence among Blacks (20%) and Hispanics (16%) is much higher when compared to Whites (7%).6 Food insecurity is more prevalent among people with T2D when compared to those without (16% versus 9%).7 Since following a healthful diet is central to T2D management, food insecurity is a major barrier, especially among underrepresented groups.1
Numerous studies demonstrate that food insecurity is a risk factor for suboptimal glycemic management due to the inability to afford healthy foods, lower medication adherence, and increased distress.1,8–11 Achieving individualized glycated hemoglobin (HbA1c) targets is important for reducing the risk of diabetes complications, such as retinopathy, nephropathy, cardiovascular disease, amputations, and preventable mortality.12 The higher prevalence of T2D and food insecurity among underrepresented groups tracks with the higher prevalence of poor glycemic control and diabetes complications in these groups compared to Whites.13 Food insecurity can lead to poor glycemic control and increased health care utilization, resulting in less disposable income that reinforces this cycle, suggesting that targeted efforts to prevent food insecurity are important in T2D.14
COVID-19-related disruptions have likely impacted daily living for all Americans, but vulnerable populations are especially impacted by the socioeconomic changes.15 Temporary closure of businesses led to the rise in unemployment rates from 3.5% to 14% and contributed to the increase in food insecurity prevalence to 38% in March 2020.15,16 This translates to increased demand for food aid during times of decreased food availability due to panic purchasing and more meals being consumed at home as opposed to in restaurants and schools.15 Research has shown that underrepresented groups have been disproportionately impacted by unemployment and food insecurity.17 Furthermore, conceptual models have suggested that COVID-19-related socioeconomic disruptions may contribute to short- and long-term health outcomes, such as poor glycemic control among people with T2D.15 Literature published during the COVID-19 pandemic postulates that existing racial disparities will be magnified, leading to more chronic disease complications through pathways that include increased food insecurity prevalence and severity.15–17 Although studies cite reduced access to healthy food during the COVID-19 pandemic as a barrier to diabetes self-management, less is known about longer-term glycemic impacts resulting from changes in food security.18,19
There is limited research comparing food insecurity prevalence before and during the pandemic among people with T2D and examining the change in food insecurity with change in HbA1c during this time. Furthermore, no previous research has tested effect modification by race in the association between food insecurity and HbA1c. Addressing these knowledge gaps is important for informing resource allocation strategies during public health emergencies and ensuring that disproportionately impacted groups are prioritized. Through a cross-sectional study design, we aimed to 1) compare food insecurity prevalence before and during the COVID- 19 pandemic in North Carolina, 2) estimate associations between food insecurity and HbA1c during the COVID-19 pandemic, and 3) estimate associations between change in food insecurity and change in HbA1c from before to during the COVID-19 pandemic, overall and by race.
Methods
Participants
Adults aged ≥ 30 years diagnosed with T2D for at least one year, English-speaking, and affiliated with the endocrinology clinic at the University of North Carolina at Chapel Hill (UNC) were eligible. Pregnant women were excluded due to the unique impacts on HbA1c during pregnancy. Upon IRB approval, convenience sampling was used to recruit participants seen in clinic and online via a ResearchForMe@UNC posting (< 5% of participants recruited online). This recruitment tool was offered through the UNC IRB application and connected prospective participants with research teams. Those who expressed interest were sent a screening survey to determine eligibility. If eligible, consent forms and surveys were sent via email, followed by an electronic gift card upon survey completion. For in-clinic recruitment, electronic health records (EHR) were used to screen for eligible patients on the following day’s clinic schedule. A research team member met eligible patients during their clinic visit (while they were waiting) to introduce the study. Consent and survey forms were completed in private rooms during waiting periods or after the participants finished their clinic visit. Each participant received a $10 gift card upon survey completion.
Measurements
Participants filled out a survey in summer 2021 that retrospectively assessed food security before the COVID-19 outbreak (March 2019 to February 2020) and during the COVID-19 outbreak (March 2020 to February 2021). This survey also captured FI duration and frequency, perceived impact of COVID-19 on food security, COVID-19 diagnosis, diabetes complications and duration, household size, dependents, education, and employment.
The six-item short form US Household Food Security Survey Module measured food security.20 Response options included affirmatives (e.g., “often true,” “sometimes true,” “yes”), negatives (e.g., “never true,” “no”), and “refuse to answer”.20 Affirmatives were summed to generate a food security score where 0–1, 2–4, and 5–6 described food security, low food security, and very low food security, respectively.20 This short form is a reliable substitute for the 18-item Food Security Survey Module and reduces participant burden (97.1% concordance).20,21
Age, race, biological sex, insurance type, diabetes medication, and HbA1c were retrieved from EHR. Multiple HbA1c values within the year before the COVID-19 outbreak (March 13, 2019, to March 12, 2020) and within a 1.25-year period during the pandemic (March 13, 2020, to June 12, 2021) were averaged. The additional three months were intended to capture potential lagging effects of FI during February 2021 on HbA1c, because red blood cell turnover rate is three months, which corresponds to the time between HbA1c measurements. Change in HbA1c was calculated by subtracting mean HbA1c before the pandemic from mean HbA1c during the pandemic.
Data Analysis
Chi-square and t-tests were used to compare participant characteristics by race. Since more than 5% of participants were missing pre-pandemic HbA1c and change in HbA1c, chi-square and t-tests compared missing and non-missing groups across variables in Table 1. Imputation was used to replace 11 “refuse to answer” responses on the food security survey (n = 8) with a response from a similar participant matched by age, sex, insurance, education, employment, and food security questions.22 This was done to prevent selection bias caused by potential differences between people who checked “refuse to answer” on the survey compared to those who did not. McNemar’s test was used to compare FI prevalence before and during the pandemic, overall and by race.
Prior to adjusted analyses, to determine the most appropriate specification of independent variables, functional form was assessed by examining distributions and association with HbA1c using simple linear regression. Race and diabetes medication were dichotomized to White versus non-White and insulin versus no insulin, respectively, due to sample size limitations. Food security scores 0–1, 2–4, and 5–6 were specified as food secure, moderately FI, and very FI, respectively, while HbA1c and age were continuous. Change in FI was categorized as no change, increase, and decrease, based on the change in food security scores from before to during the pandemic.
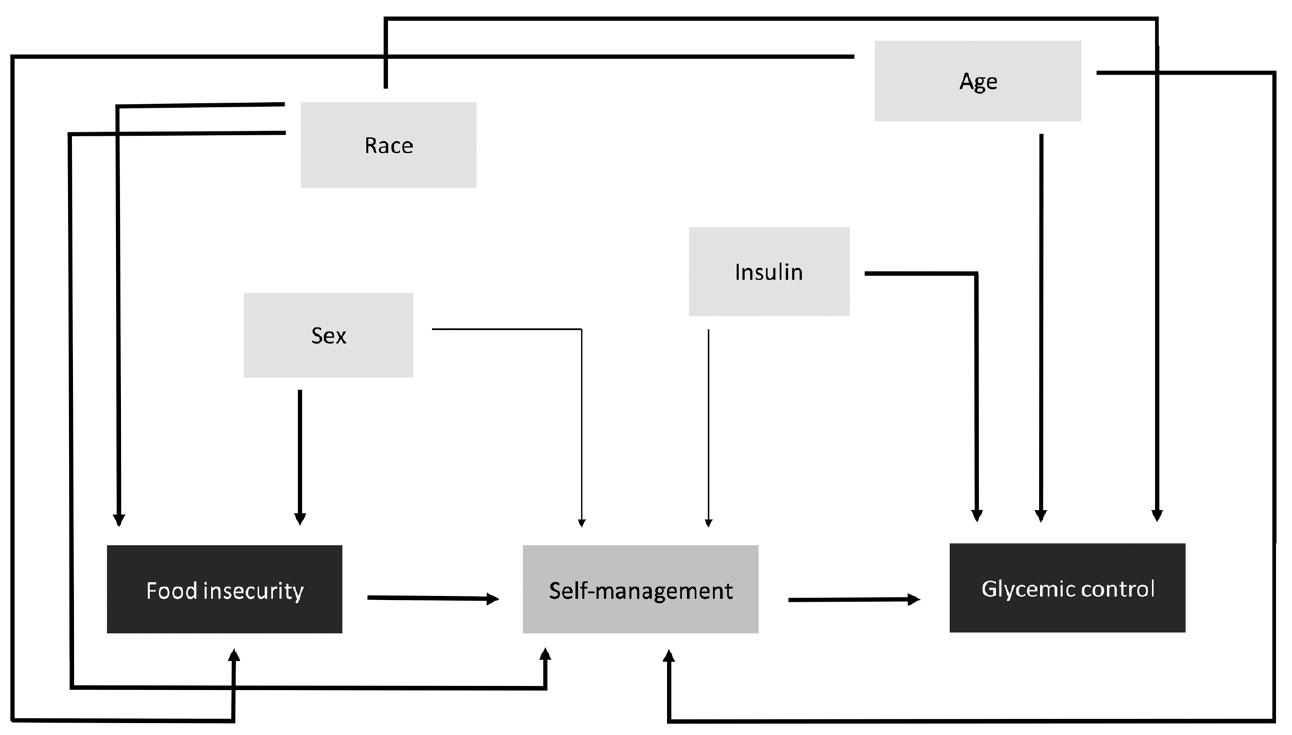
Multiple linear regressions estimated associations between 1) FI and HbA1c and 2) change in FI and change in HbA1c. The fully adjusted linear regression model included all potential confounders in our directed acyclic graph (DAG), which was informed by previous literature (Figure 1). The full model was compared to more parsimonious models by examining the AIC, precision of the estimates, and beta coefficient percent change (10% was the threshold for confounding). To assess effect modification by race, an interaction term was added to the full model. We compared the magnitude and precision of stratum-specific estimates and used the likelihood ratio test (LRT) to test the significance of the interaction between race and food insecurity. A p-value < .05 was considered statistically significant in all analyses. We conducted analyses in SAS, version 9.4 (SAS Institute, Cary, NC).

Results
Sample Description
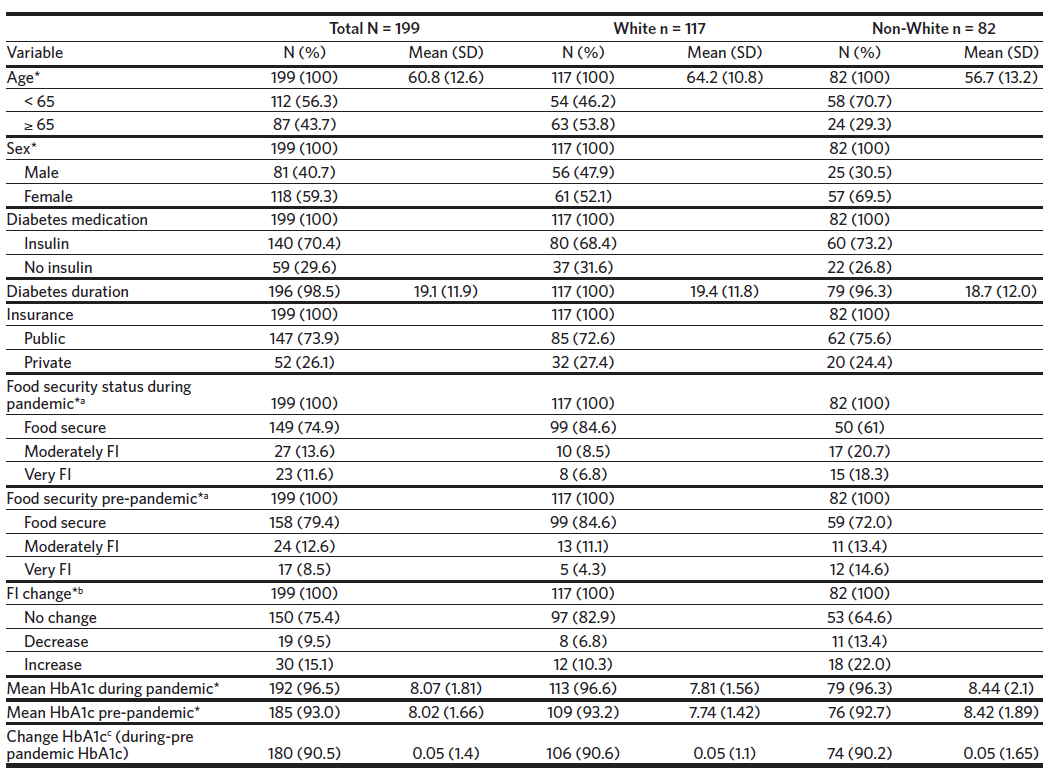
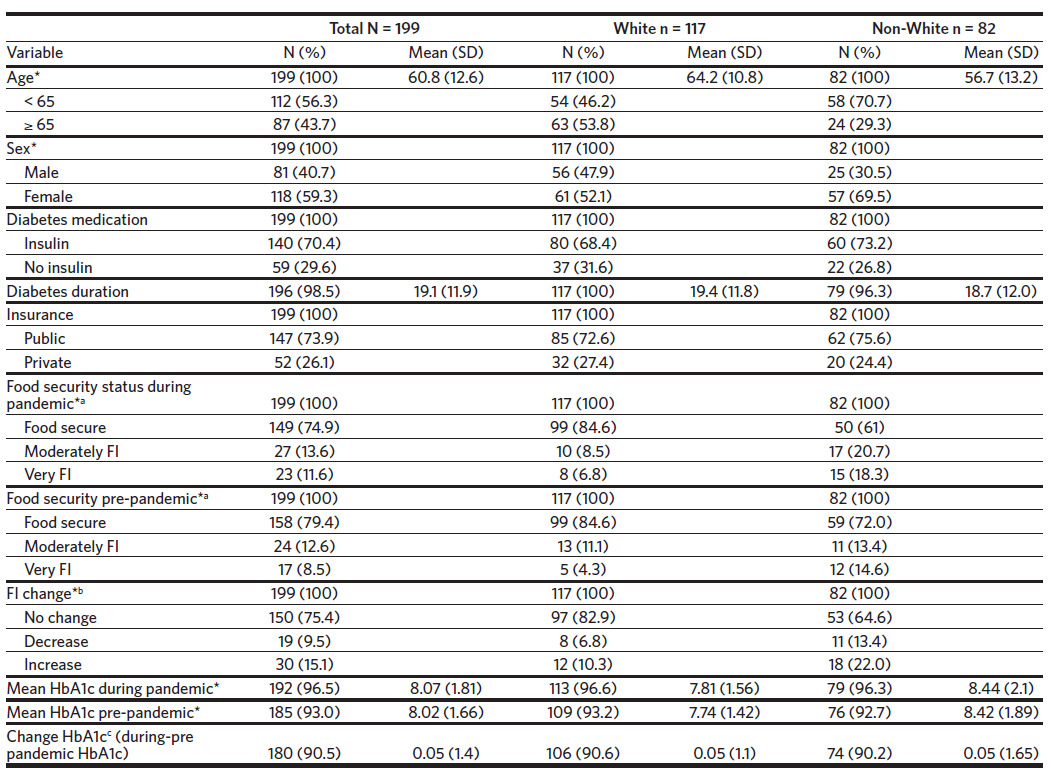
We recruited 203 participants but four were excluded due to ineligibility (n = 2) and missing surveys (n = 2). Majority of the participants were White (59%), female (59%), used insulin (70%), had a mean age of 61 years ± 13, and a mean T2D duration of 19.1 years ± 11.9. The number of eligible participants who were seen in clinic during summer 2021 was 1093, where 54.5% were White, 54.3% were female, and 55.8% were under age 65, which is similar to our sample. Those missing pre-pandemic HbA1c or change in HbA1c were not significantly different from the non-missing group in terms of age, race, sex, insulin use, diabetes duration, insurance, food security status, FI score change, and mean HbA1c during the pandemic (all p < .05). FI prevalence during the pandemic was 25.1% (13.6% moderately FI and 11.6% very FI). The majority (75%) experienced no change in FI while 15% experienced an increase in FI from before to during the pandemic. FI prevalence and HbA1c were significantly higher among non-Whites compared to Whites at both time periods (Table 1).
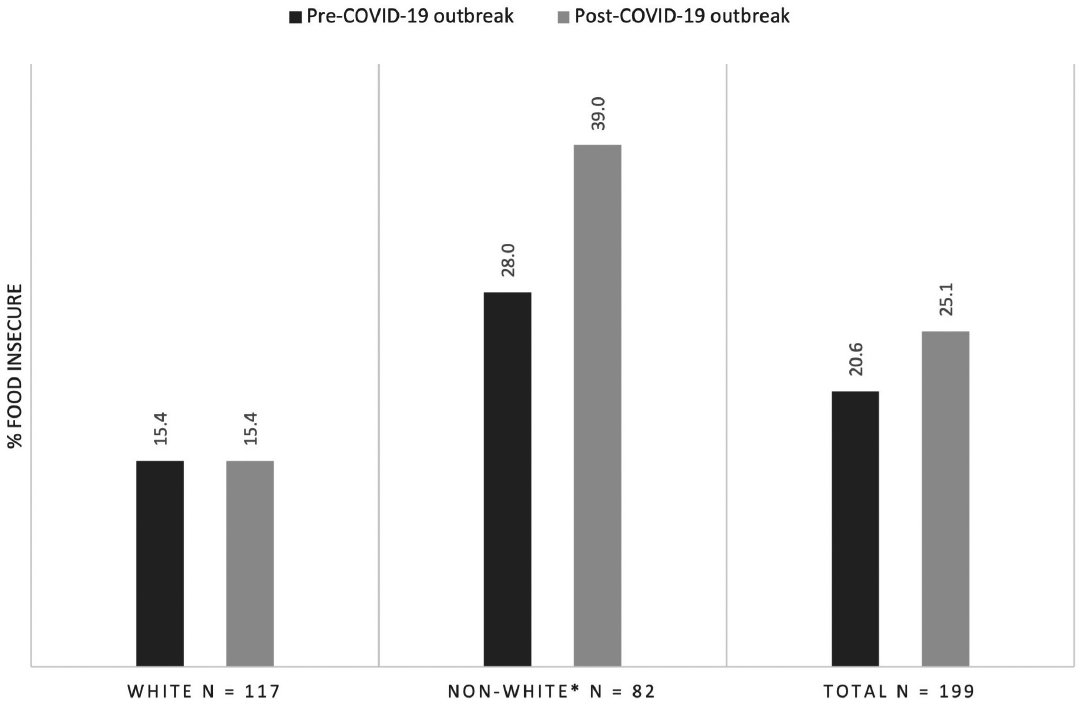
Figure 2 compares FI prevalence before and during the pandemic in the total sample and by race. Before the pandemic, FI prevalence was 20.6% but the prevalence among non-Whites was about twice that of Whites (28.0% versus 15.4%). The prevalence of FI during the pandemic was 25.1% but the prevalence among non-Whites was 39.0% compared to 15.4% among Whites. The difference in FI prevalence between the two time points was not statistically significant (p = .11) in the full sample but was statistically significant among non-Whites (p = .049).

Associations Between Food Insecurity and HbA1c
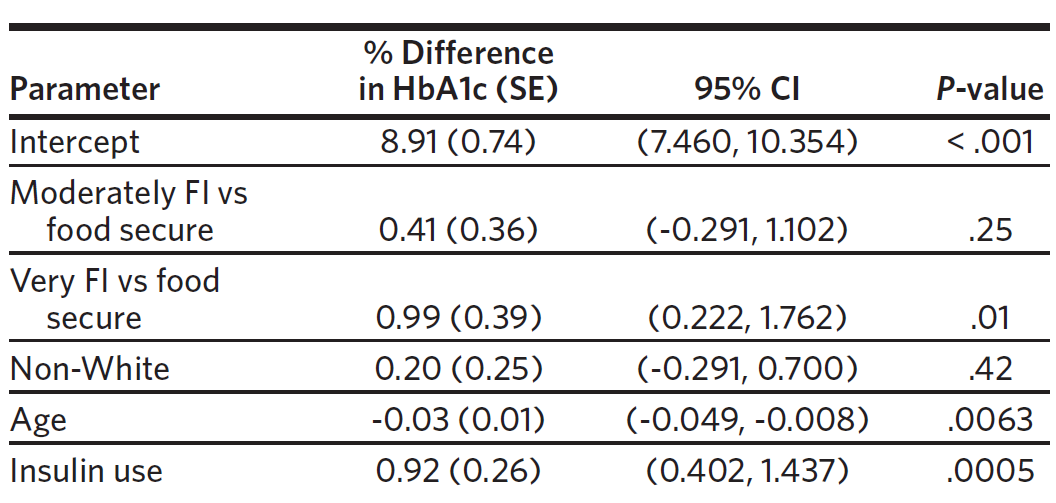
The unadjusted association between FI and HbA1c during the pandemic was statistically significant where HbA1c among those very FI was 1.65% higher than those food secure (95% CI: 0.883, 2.420, p < .0001). As shown in Table 2, the association between FI and HbA1c during the pandemic was still significant after adjusting for race, age, and insulin use. HbA1c among those very FI was 0.99% (95% CI: 0.222, 1.762, p = .01) higher than those food secure. Effect modification by race was statistically non-significant (LRT = 2.7, p = .26), but stratum-specific estimates were quite different. Among Whites, the difference in HbA1c comparing very FI to food secure was 1.72% (95% CI: 0.525, 2.915, p = .005) while the difference was 0.53% (95%CI: -0.443, 1.501, p = .29) among non-Whites.
_during_the_1-year_period_after_the_covid-19_outbreak_comparing_food.png)
Association Between Change in Food Insecurity and Change in HbA1c
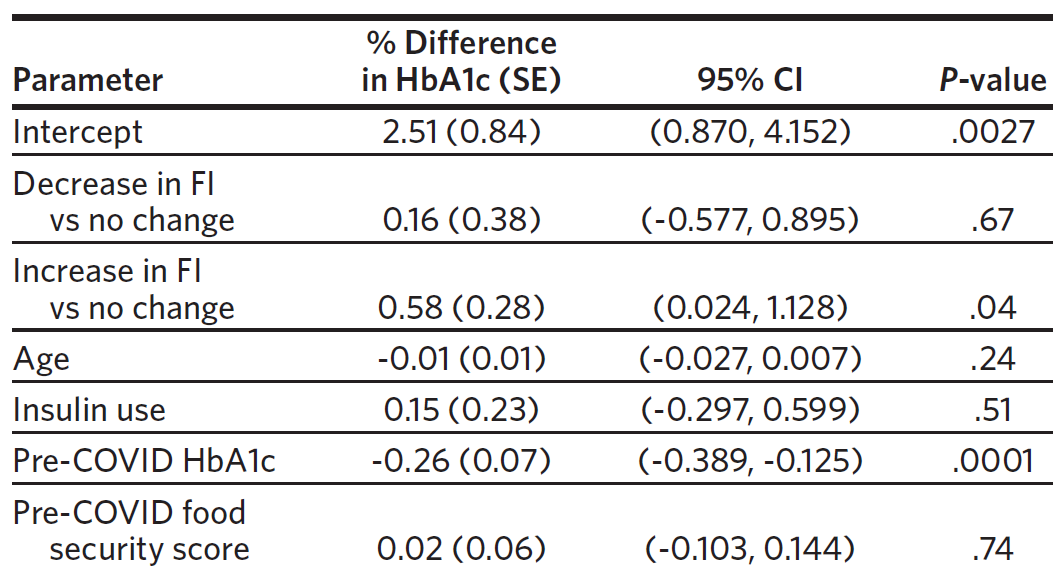
The association between change in FI and change in HbA1c was statistically significant when adjusted for pre-pandemic mean HbA1c only. The increase in HbA1c was 0.68% higher among those with increased FI compared to those experiencing no change (95% CI: 0.130, 1.227, p = .02). As shown in Table 3, after adjusting for age, insulin use, pre-pandemic food security score, and pre-pandemic mean HbA1c, the association between increase in FI and increase in HbA1c was statistically significant. The increase in HbA1c among those with an increase in FI was 0.58% higher than among those experiencing no change (95% CI: 0.024, 1.128, p = .04). Although effect modification by race was statistically non-significant (LRT = 1.7 and p = .43), stratum-specific estimates were quite different. Among Whites, those with increased FI had a change in HbA1c that was 0.96% (95% CI: 0.147, 1.778, p = .02) higher than those experiencing no change in FI. Among non-Whites, those with increased FI had a change in HbA1c that was 0.25% (95% CI: -0.491, 0.996, p = .51) higher than those experiencing no change in FI.

Discussion
The prevalence of FI was higher during the pandemic compared to before despite statistical non-significance. This aligns with previous studies reporting increased FI prevalence during spring 2020 in the United States.17,23–25 The prevalence of FI at both time points in our sample was about double the national average in 2019 and 2020 due to purposeful sampling of high-risk groups for FI who are underrepresented in national surveys.4,6 Our estimate is consistent with previous literature stating that FI is more prevalent among T2D populations.4 The observed significant difference in FI prevalence comparing before and during the pandemic among non-Whites provides evidence for an exacerbation of racial disparities.16,17 This finding highlights the importance of stratifying future analyses by factors associated with FI vulnerability as overall prevalence may mask racial disparities.
Measuring FI prevalence over an entire year post- COVID-19 outbreak as opposed to immediately after may explain the lower prevalence estimates observed compared to those previously published.16,17,23 Trends in FI prevalence from April 2020 to March 2021 indicate that FI prevalence was highest in April 2020 and leveled off to pre-pandemic prevalence during mid-2020, which aligns with the United States Department of Agriculture’s (USDA) estimate for 2021 (~10%).6,26 Additionally, differences in the questions and number of questions used to assess FI and different types of samples may influence prevalence estimates.
There was a positive association between FI and HbA1c during the pandemic, where mean HbA1c among those very FI was ~1% higher than among those who were food secure. Increased FI was positively associated with increased HbA1c. The increase in HbA1c among those with increased FI was 0.6% higher than among those with no change. Among those with increased FI, the mean increase in food security score was ~ 2, which is large enough to change food security status. These findings suggest that severe FI and increasing FI have large negative impacts on glycemic control since it was associated with a clinically significant difference in HbA1c.12 Further research is required to understand the volatility of FI on HbA1c, as we did not observe an association between decreased FI and change in HbA1c.
Although no effect modification by race was detected, the magnitude of associations was quite different between race strata. The difference in HbA1c comparing very FI to food secure was significant among Whites only. Since the mean HbA1c among Whites who were food secure was 0.5% lower (HbA1c = 7.6% ±1.39) than among non-Whites who were food secure (HbA1c = 8.1% ± 2.19), the difference in HbA1c when comparing very FI to food secure may be larger among Whites and therefore more easily detected. However, the higher HbA1c among non-Whites even when food secure may have greater implications on long-term health risks when FI occurs.
The generalizability of these results is limited due to the sample of patients from an endocrinology clinic who may differ from the general T2D population (e.g., higher socioeconomic status). Convenience sampling may contribute to underestimates in FI prevalence and severity, mean HbA1c, and therefore estimates of associations due to the exclusion of high-risk groups (e.g., Spanish-speaking Latinos, low-income groups). It has been established that convenience samples underestimate food insecurity prevalence compared to targeted sampling of high-risk groups.17 Participants recruited from clinics may have better glycemic control due to consistent access to health care.14 The exclusion of individuals with severe FI and suboptimal glycemic control from the non-White stratum may explain the small and non-statistically significant associations.
Recall bias leading to misclassification of food security status is another key limitation because food security status was determined retrospectively, up to two years prior to survey administration. This could have resulted in an underestimate of FI prevalence at both time periods and may underlie why no statistically significant difference in HbA1c was observed when comparing moderately FI to food secure, since people may more reliably remember severe FI. Additionally, this smaller estimate suggests that glycemic management may be impacted when very FI rather than moderately FI, but further research is needed to determine the severity at which FI begins to have a clinically relevant impact on glycemic management. Recall bias that obscured differences between those with a decrease and no change in FI, along with a small sample of those who experienced a decrease in FI (n = 19), may also explain why we were unable to detect significant differences in change in HbA1c.
Additional limitations include a smaller sample size of non-Whites that may have compromised the power needed to detect differences in HbA1c between FI categories. Further, information on income, nutrition assistance benefits, and BMI was not collected. Public insurance status was supposed to be a proxy for income but was an unsuitable proxy since it was not associated with food insecurity or HbA1c. We were unable to examine the potential confounding effects of these variables and therefore cannot preclude the presence of residual confounding from the observed estimates.
Future Directions
Additional research is needed to determine if the association between food insecurity and HbA1c differs by race and likewise for the association between change in food insecurity and change in HbA1c. This is critical for efficient resource distribution that maximizes health impacts. Incorporating a qualitative component to the effect modification analysis would facilitate understanding of how the experience of food insecurity may differ by race and support the discussion of quantitative results. Lastly, studying a longitudinal cohort that more closely represents the target population will help minimize selection and recall bias, determine the FI severity level that begins to impair glycemic control, and identify other indicators relevant to FI, race, and the short- and long-term management of diabetes.
Conclusion
Screening and targeted resource allocation to groups at risk for FI and suboptimal glycemic management should be considered early during public health emergencies to prevent increases in HbA1c and diabetes complications, which have long-term implications on quality of life and health care costs at the individual and societal level. Given that underrepresented groups and low-income populations are already more vulnerable to FI and suboptimal glycemic management, ongoing surveillance of social, economic, and health indicators among these populations may be a fundamental step for rapid mobilization of resources during periods of economic instability and to prevent widening health disparities. It is critical that health care professionals who encounter T2D patients be cognizant of increased FI risks and be equipped to screen and connect patients with community resources to help prevent additional obstacles to glycemic management.
Acknowledgments
This project was supported by Dr. Elizabeth Mayer-Davis’s Cary C. Boshamer professorship funds and the Honors Thesis Research Award from Honors Carolina.
Disclosure of interests
Authors report no conflicts of interest.