

Since the 1970s, blood lead levels (BLLs) in children have steadily declined due to increased regulation of lead in consumer products and increased emphasis on lead poisoning prevention.1,2 The CDC maintained a blood lead action level of 10 micrograms per deciliter (μg/dL) for many years, despite accumulating evidence of adverse health effects even at lower levels of lead exposure. In 2012, the Centers for Disease Control and Prevention (CDC) recommended a reference value of greater than or equal to 5 μg/dL to identify children with high levels of lead in their blood, which corresponded with (National Health and Nutrition Examination Survey) NHANES data that showed 97.5% of US children aged 1–5 had BLLs below 5 μg/dL.2 In 2021, the CDC further reduced the reference value to 3.5 μg/dL.3
Although universal blood lead testing is encouraged for any child aged 12 to 36 months and any child aged 36 to 72 months with no record of a previous blood lead screening test, it is only required for children enrolled in Medicaid.4 Additionally, the start of the COVID-19 pandemic disrupted routine lead screening, as evidenced by a 52% decline in testing from April 2019 to April 2020 in North Carolina.5 The recall of LeadCare® test kits in 2021 also contributed to the decline in testing.6 This marked reduction in testing occurred just when children were spending more time at home because of social restrictions and may have been at increased risk for lead exposure as a result.7–9
Despite progress in lead poisoning prevention, research has consistently shown that there is no safe BLL for children.10,11 Behavioral and cognitive deficits are associated with lead exposure,12,13 even at low levels. For example, studies have demonstrated that BLLs less than or equal to 5 μg/dL are associated with lower IQ,14,15 decreased cognitive functioning,16 and neurobehavioral deficits.17 Several studies have shown a steeper decline in IQ with increases in blood lead concentrations at lower compared to higher levels.14,15,18–20 Additionally, low-level lead exposure has been linked with higher crime rates and antisocial or delinquent behaviors in adolescents. In both individual- and aggregate-level studies, lead exposure is a robust predictor of school disciplinary problems in adolescence and violent and nonviolent crime in adulthood.21–24 Lead exposure remains a persistent threat to the health and neurological development of children.
Healthy North Carolina 2030 focuses on improving health equity and social and economic factors contributing to health outcomes.25 North Carolina’s growing Black and Brown populations are experiencing worse health outcomes.25,26 According to the Healthy North Carolina 2030 report, Black Americans and American Indians have the highest infant mortality rates in North Carolina and lowest life expectancies.25 Similarly, Black and Brown children and children in lower-income communities are at greater risk of lead exposure.27,28 While the Healthy North Carolina 2030 initiative does not aim to reduce lead exposure and BLLs directly, it aims to improve third grade reading proficiency and severe housing problems like overcrowding, high housing costs, and lack of kitchen and/or plumbing facilities.25 Poor housing conditions, particularly older houses in disrepair, have been linked to higher BLLs, which lead to poorer education outcomes.25,29 Low-level lead exposure at age 2 has been inversely associated with academic performance at age 10.30 Our past research shows BLLs in early childhood are negatively associated with educational achievement, particularly for educational outcomes like fourth grade reading and mathematics proficiency, as measured by performance on end of grade (EOG) standardized tests in a clear dose-response pattern.31,32 Additionally, early childhood lead exposure is a significant predictor of being identified with learning or behavioral disorders in educational records.33 Both performance on EOG testing and learning and behavioral disorders have long-term implications and are correlated with socioeconomic status in adulthood.34 Negative effects are observed with BLLs as low as 2 μg/dL.
To achieve a healthier North Carolina in 2030, we must continue to reduce BLLs in the population. However, identifying children at high risk for exposure is challenging, especially in the absence of individual-level childhood blood lead data and the presence of data reporting delays and data quality issues.35
Given the known social and economic contributors to childhood lead exposure, publicly available census data provide an opportunity to identify areas at high risk for childhood lead exposure. In previous work, we constructed geographic information system (GIS)-based childhood lead exposure models at the tax parcel level to identify children most at risk of lead exposure.36,37 Unfortunately, such tax parcel-level models are only possible in counties where tax assessor data include year built—roughly 50% of North Carolina’s counties. Here, we adapt the Children’s Environmental Health Initiative (CEHI)'s tax parcel-level lead model to the ZIP Code Tabulation Area (ZCTA) level to identify high-risk ZIP codes for childhood lead exposure across the state of North Carolina. We validate the models using blood lead testing data for 2010–2015, which were obtained from the North Carolina Department of Health and Human Services (NCDHHS).
Methods
Blood Lead Data
We obtained BLLs testing data from the Childhood Lead Poisoning Prevention Program of the NCDHHS Division of Public Health, Environmental Health Section in Raleigh, North Carolina for the years 2010–2015. The 2015 records were the latest data available to us. This modeling approach is designed to be updated as new data are made available and can be adapted to any state in the United States. The blood lead testing data include child name, birth date, test date, BLL, type of test (venous or capillary), and home address. The data were provided pursuant to a data use agreement. During the study period, all children with BLLs below the level of detection were assigned a value of 1 μg/dL. BLLs were recorded and stored in the state database as integer values.
Data Restrictions
We restricted the dataset to georeferenced records for children between age nine months and seven years and BLLs between 0 μg/dL and 300 μg/dL. For children with multiple records, we selected the record with the highest BLL.
Aggregating to ZCTAs
We aggregated log normalized BLLs at the ZCTA level and combined with ZCTA-level census data (2011–2015 American Community Survey five-year estimates) for known risk factors of childhood lead exposure. ZCTAs are generalized areal representations of United States Postal Service (USPS) ZIP code service areas.38 The Census Bureau assigns the most frequently occurring ZIP code within a census block to the entire census block. Then, census blocks are aggregated by code to create larger areas known as ZCTAs. In most cases, ZCTA and ZIP codes are the same for an address. We opted to use ZCTA-level data instead of census tracts or block groups to easily translate results to the ZIP code level, which is more meaningful for and usable in community and health care applications. ZCTA-level census data indicate there are a total of 1,080 ZIP codes among 808 ZCTAs for the state of North Carolina. We removed ZCTAs with a total population of 0 or any missing census data, bringing the total to 1,036 ZIP codes among 775 ZCTAs.
Modeling
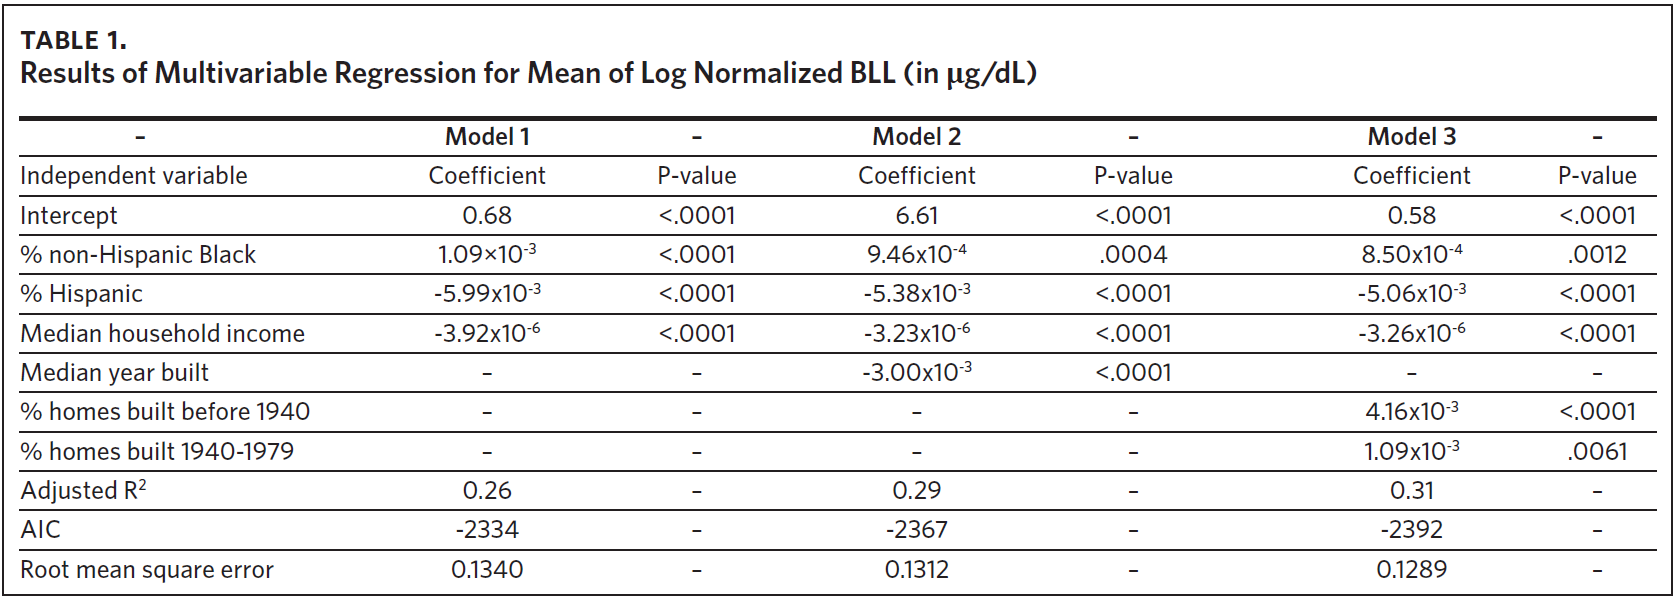
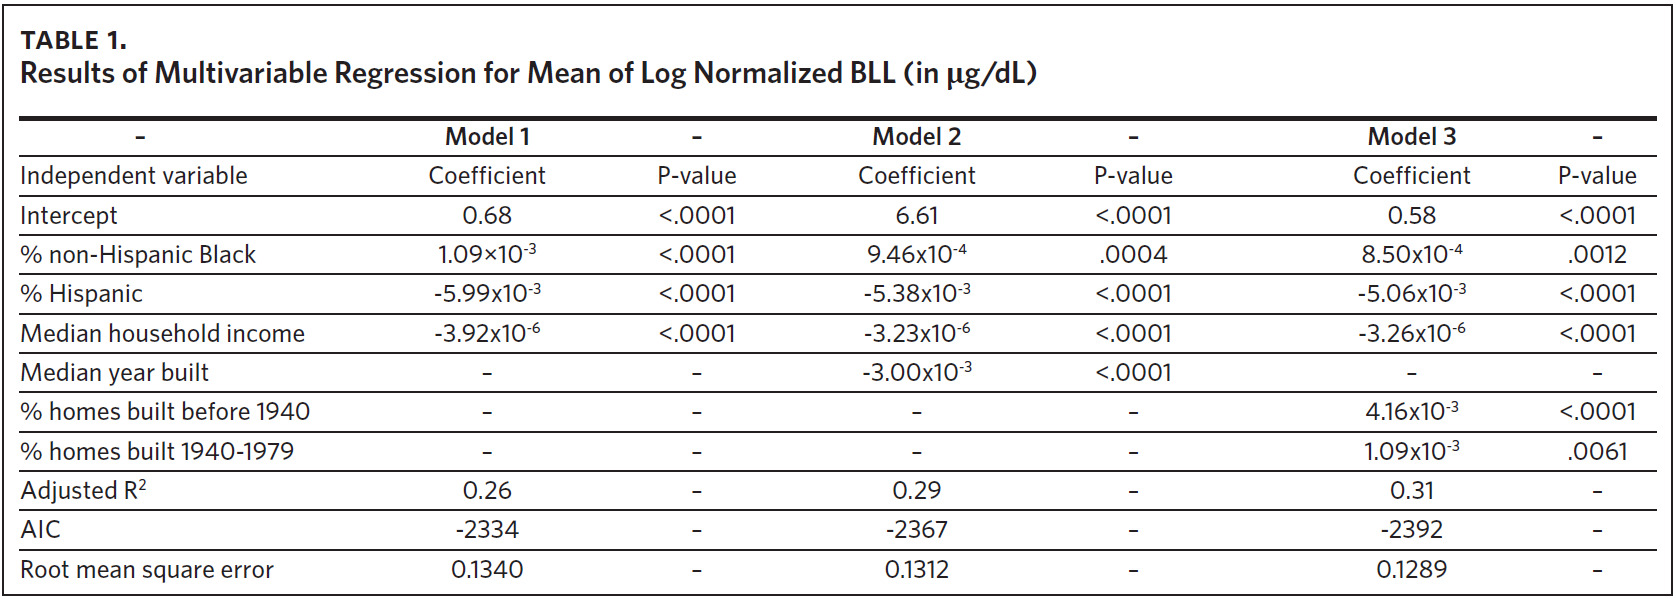
To fit a multivariable regression model, 2010–2014 records were used as a training data set, and 2015 records were used as a validation data set. The training data set included 775 ZCTAs, and 767 ZCTAs were included in the validation data set. The ZCTA-level mean of log normalized BLLs served as the dependent variable. We ran three models using explanatory variables commonly found in the literature.39 The first model contained demographic risk factors of lead exposure, including % non-Hispanic Black, % Hispanic, and median household income. The second model included the demographic risk factors and median year built, a variable to represent the environmental risk factor age of housing. The third model included the demographic risk factors and age of housing represented using two variables: % of housing units built before 1940 and % of housing units built from 1940 to 1979. Model fit information was used to assess the performance of the models.
Ranking ZCTAs
Using 2011–2015 records, we applied the vector of coefficients from the selected model to predict the expected mean of log normalized BLLs for each ZCTA. The 2011–2015 data set included 997 ZIP codes among 774 ZCTAs. We ranked the ZCTAs into 20 quantiles by predicted values and compared the distribution of elevated BLLs (eBLLs) at different quantiles to determine the appropriate priority risk categorization and identify high-risk areas for childhood lead exposure. eBLLs were defined as greater than or equal to 5 μg/dL. We also examined the distribution of eBLLs at a lower reference value of greater than or equal to 3 μg/dL. We mapped the 20 quantiles to visualize trends in childhood lead exposure at the local and state levels. All data were analyzed in SAS 9.4.40 All maps were created using ArcGIS Pro 2.9.3.41
Sensitivity Analysis
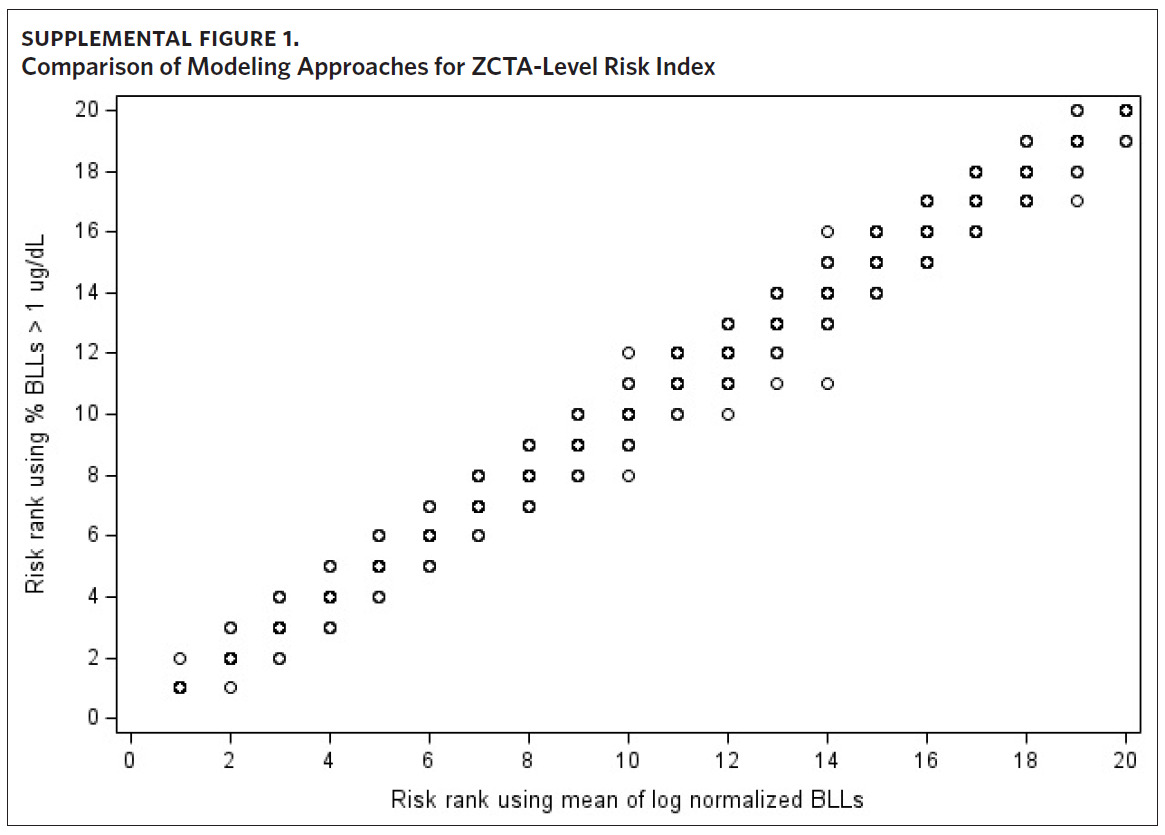
Given that there is no safe BLL for children, we performed a sensitivity analysis to determine whether the use of mean BLL in our modeling approach reliably identifies low-level lead exposure. Because all children in the BLL testing data with BLLs below the level of detection are assigned a value of 1 μg/dL, we modeled the proportion of BLLs greater than 1 μg/dL at the ZCTA level. Using 2011–2015 records, we fit a multivariate regression model where the ZCTA-level proportion of BLLs greater than 1 μg/dL served as the dependent variable, and the variables selected in the model building process served as the independent variables. We then ranked the ZCTAs into 20 quantiles by predicted values and, to compare modeling approaches, plotted the assigned rank against the priority risk categorization of the original approach.
Results
A summary of the three models considered in the model building process is presented in Table 1. The results of all models were consistent with our previous findings obtained from models that were fit using data at the tax parcel unit level.36,37 The % non-Hispanic Black, % housing units built before 1940, and % housing units built from 1940 to 1979 are positively correlated with the mean of log normalized BLLs at the ZCTA level. The % Hispanic, median household income, and median year built are inversely associated. A comparison of model fit information shows a decrease in root mean square error (RMSE) and an increase in adjusted R2 with the addition of the variable median year built to represent housing age. Model fit criteria improve further when median year built is replaced with % housing units built before 1940 and % housing units built from 1940–1970, resulting in the selection of model 3. There were 774 ZCTAs included in this analysis.
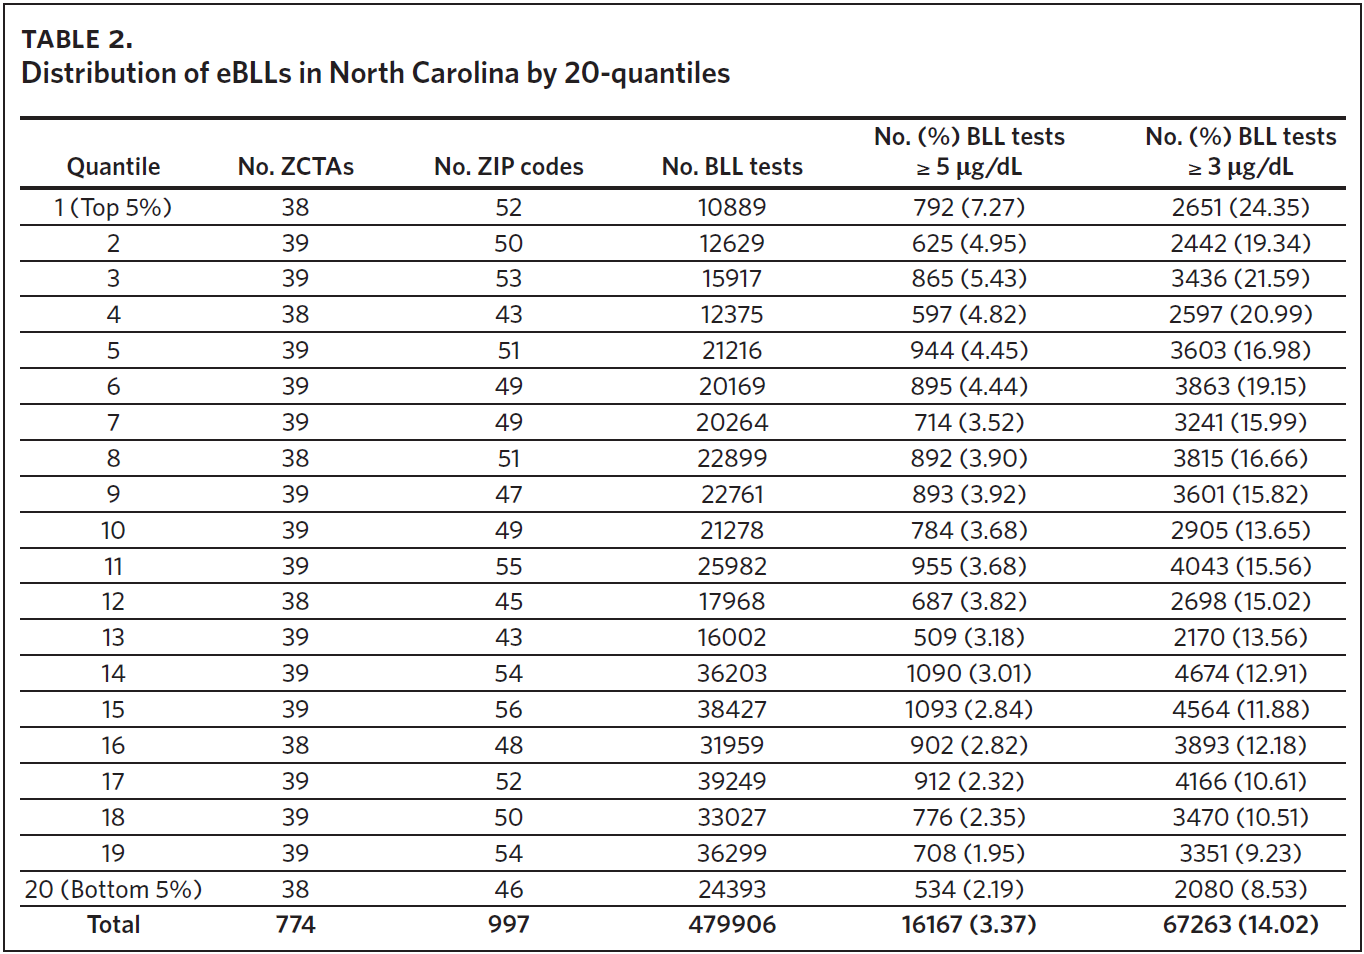
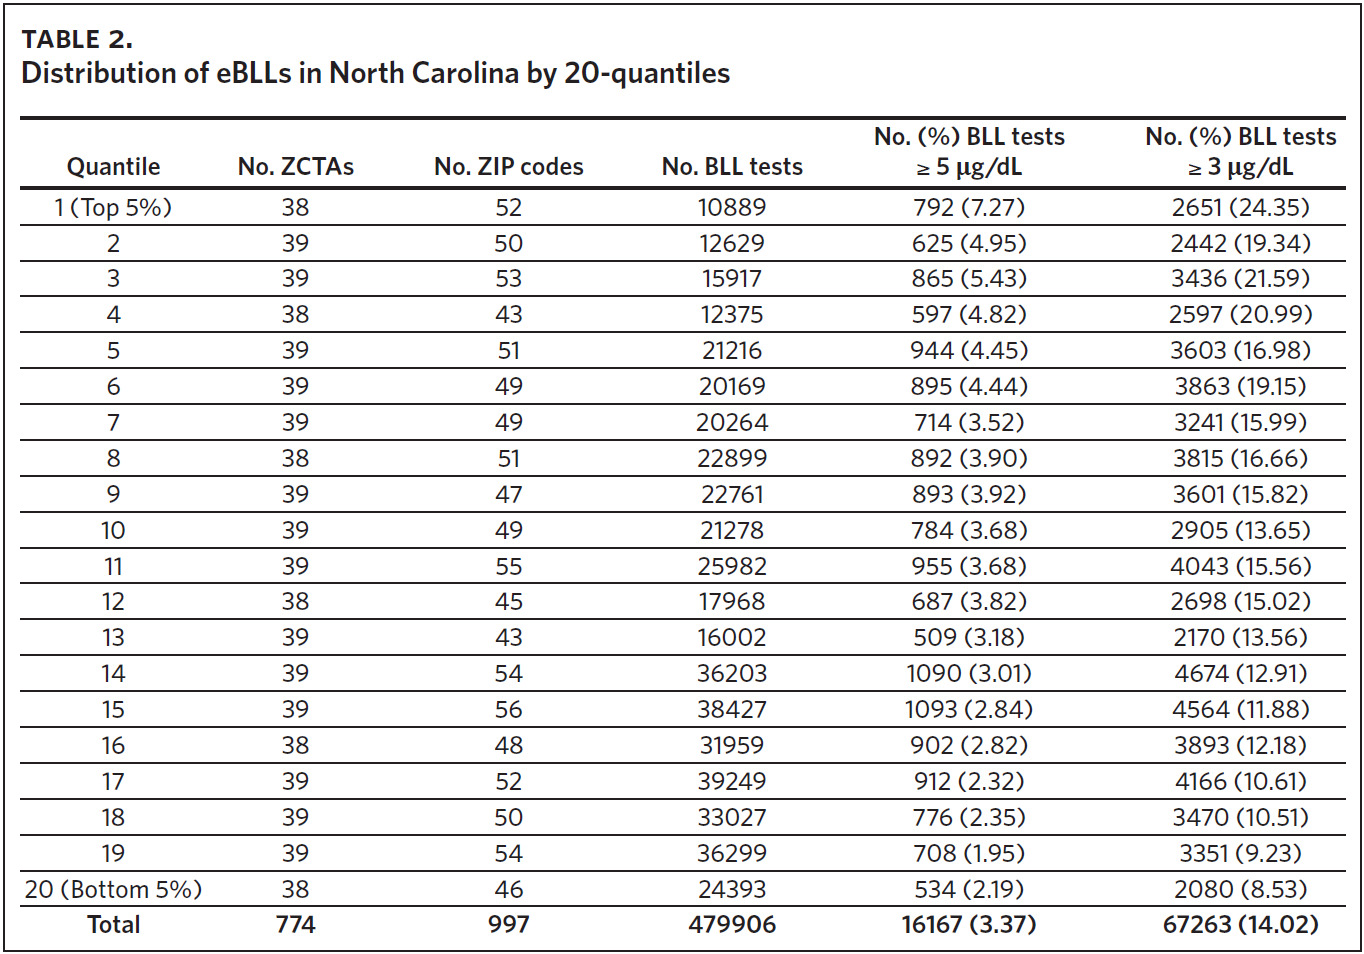
The mean of the log normalized BLLs was estimated for each ZCTA using the vector of coefficients from model 3. ZCTAs were then ranked into 20 quantiles based on the predicted values. The first quantile consists of ZCTAs with estimated BLLs in the top 5%; the second quantile represents the second highest, and so on. The 20th quantile consists of ZCTAs with estimated BLLs in the bottom 5%. Individual blood lead screening records for 2011–2015 were organized into 20 quantiles based on the rank assigned to each ZCTA and stratified by dichotomous variables for elevated blood lead levels (eBLLs) greater than or equal to 3 μg/dL and greater than or equal to 5 μg/dL (Table 2). By examining the distribution of eBLLs, we provide an example of how the model can be used to identify high-risk ZIP codes for screening in North Carolina.
Between 2011 and 2015, 479,906 children aged 7 years or younger across 997 ZIP codes and 774 ZCTAs were screened for lead in North Carolina. Of the children screened, 3.37% had eBLLs at or above 5 μg/dL and 14.02% had eBLLs at or above 3 μg/dL. Using a reference value of greater than or equal to 5 μg/dL, the prevalence of eBLLs appears to be higher among ZIP codes in the top 12 20-quantiles, whereas prevalence rates in the remaining quantiles are lower than the statewide rate. Using a reference value of greater than or equal to 3 μg/dL, eBLLs also appear to be higher among ZIP codes in the top 12 20-quantiles, with the exception of the 10th quantile.
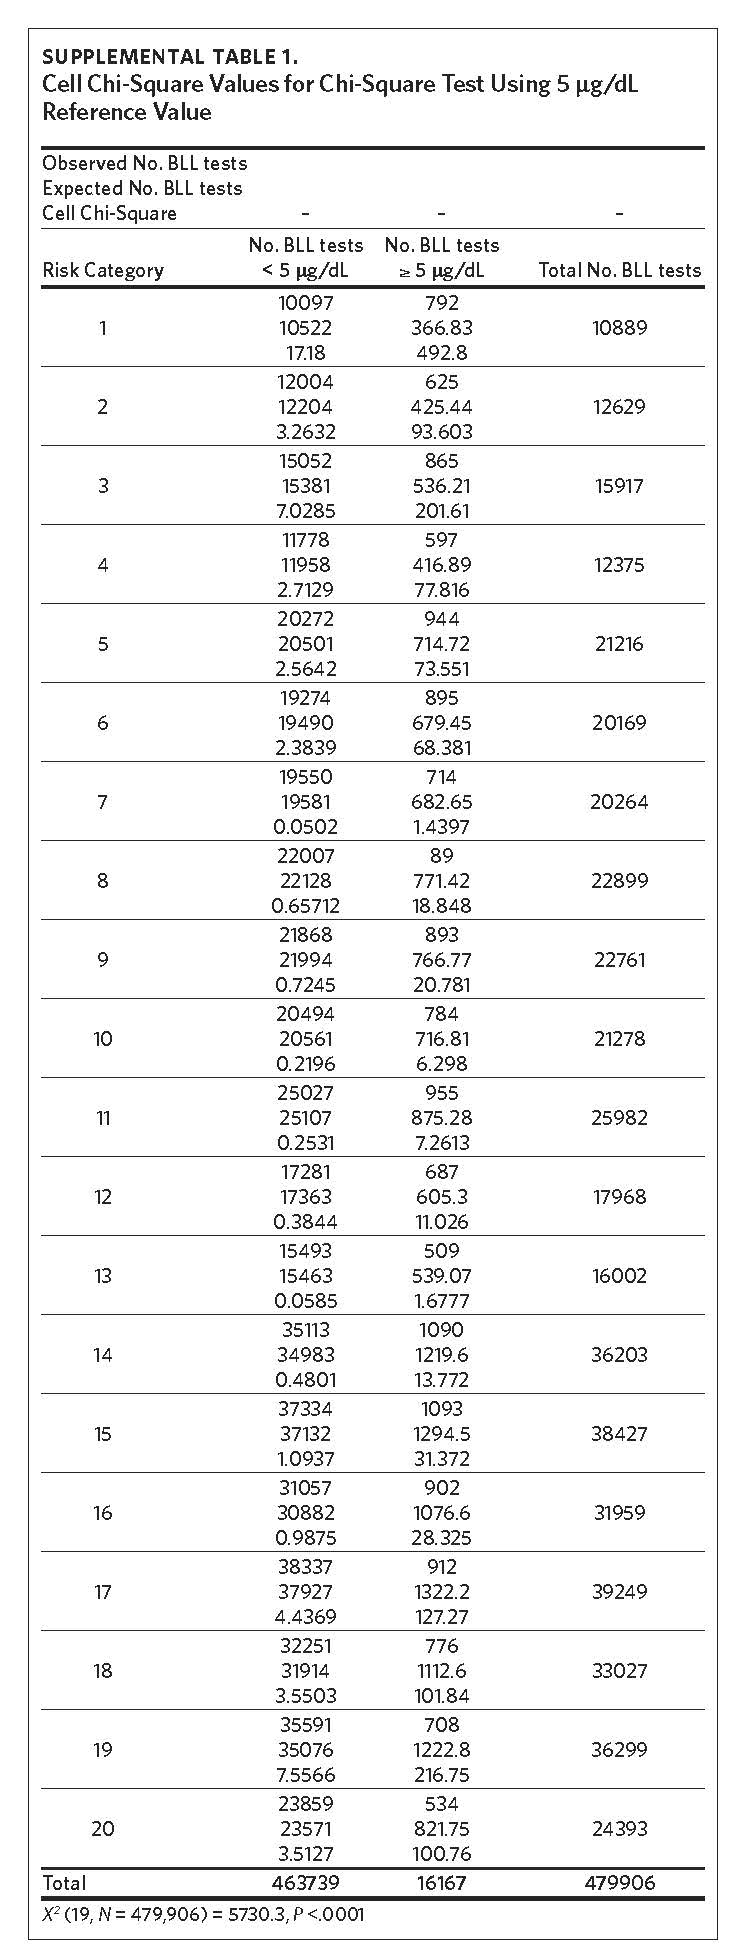
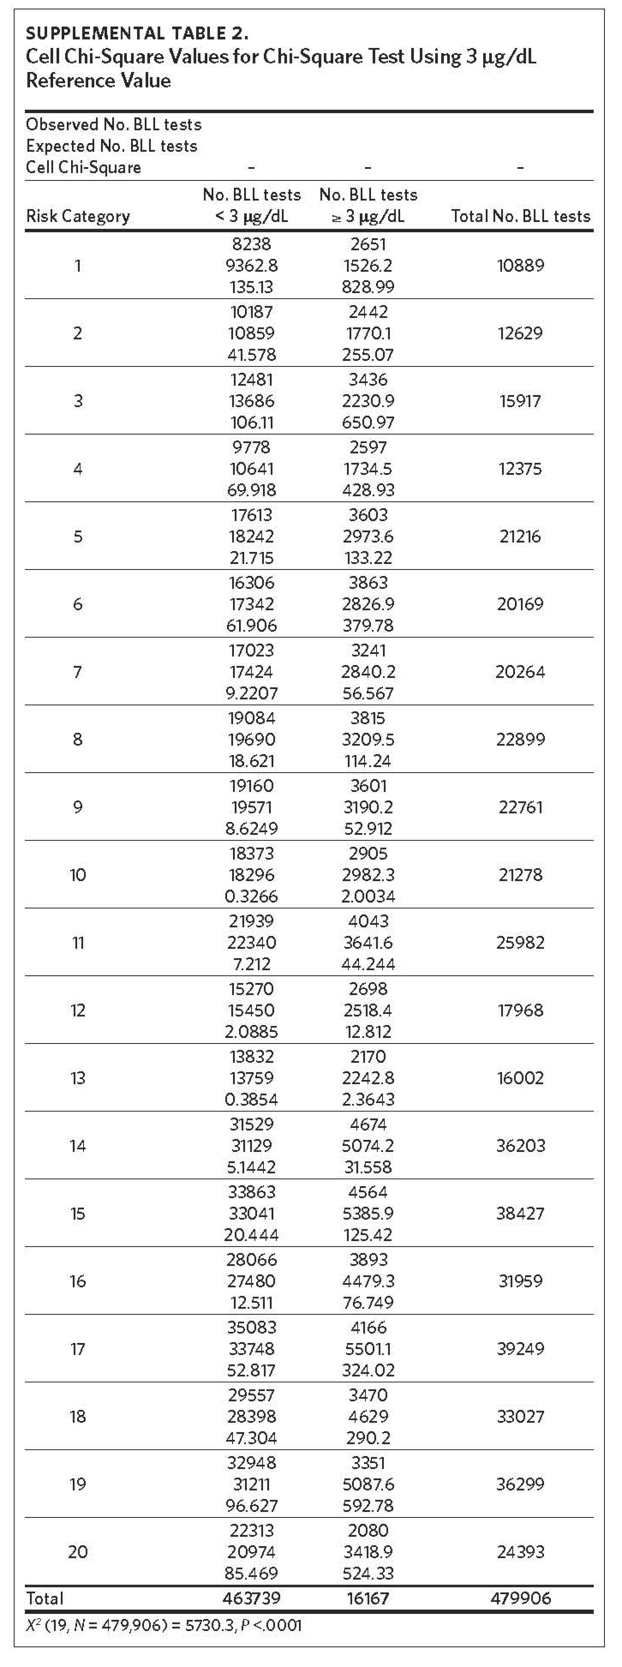
We used the chi-square test for independence to show a statistically significant association between priority risk category and prevalence of eBLLs (p-value less than .0001). Cell chi-square values show that most of this association is due to the first six quantiles (1–6), where the number of observed eBLLs is greater than expected, and the last four quantiles (17–20), where the number of observed eBLLs is less than expected (Supplemental Table 1). Conversely, the contribution of risk categories 7–16 to the total chi-square statistic is relatively small. We also observed a similar trend when using 3 μg/dL as the reference for eBLLs, although differences between expected and observed eBLLs are greater and span additional risk categories (Supplemental Table 2).

Results of the sensitivity analysis show the rank assigned to each ZCTA using the proportion of BLLs greater than 1 μg/dL as the dependent variable is comparable to the priority risk categorization of the original approach (Supplemental Figure 1). When plotting the risk rank of the original approach versus risk rank of the new modeling approach, the points are mostly along the 45-degree line. Where there are differences in priority risk categorization, it is typically by a difference of one risk rank.
Discussion
This analysis builds on our parcel-level model for childhood lead exposure risk. Whereas the parcel-level model was constructed for select counties in North Carolina (six counties in the initial analysis36 and 18 in Kim and colleagues’ 2008 analysis37), the ZCTA-level model was built using data for 775 of the 808 ZCTAs in North Carolina, covering a larger geographic area.
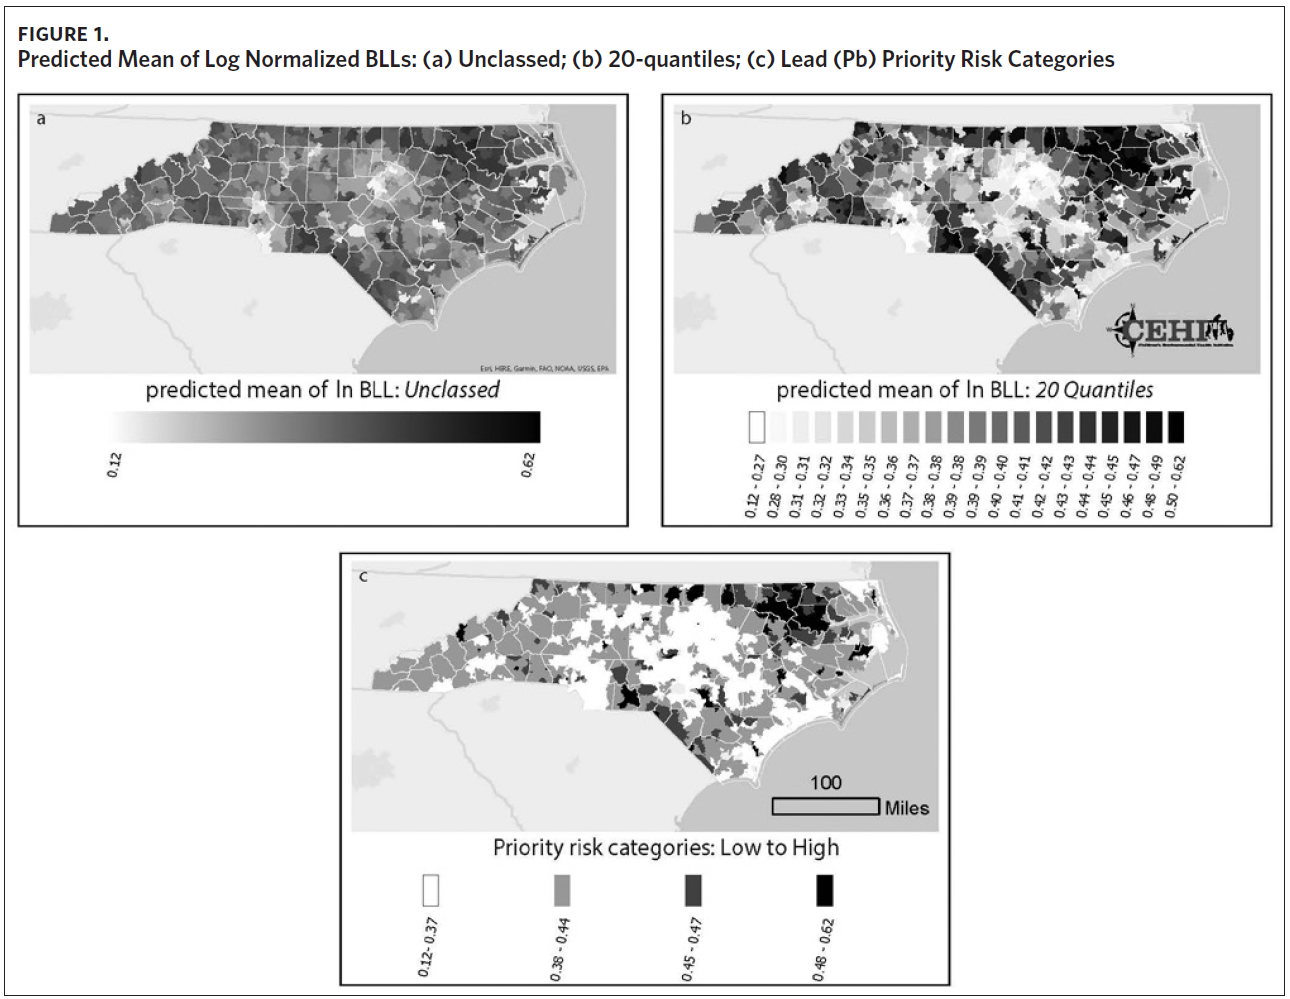
Figure 1a shows a map of the predicted mean of log normalized BLLs we generated for each ZCTA. Using this information alone, it can be difficult to determine which areas to prioritize. While Figure 1a highlights a few high-risk areas, the majority of ZCTAs in the state appear to be at moderate risk for childhood lead exposure. The use of priority risk categories provides more clarity and highlights additional areas of potential concern. Maps of the different display structures show how the model allows for flexibility and adaptation to different screening programs (Figures 1b and 1c). While the larger groupings help to visualize statewide trends in childhood lead exposure risk, smaller groupings may provide more detailed and useful information to local health departments and allow communities to use resources more efficiently.
In our consultations with the North Carolina Childhood Lead Poisoning Prevention Program, we recommended designating at least the first six quantiles as high-risk areas for childhood lead poisoning, consisting of 298 ZIP codes. However, policymakers should use whatever input process they deem most appropriate to set the cutoff. Any child in the high-risk ZIP codes should be tested for lead. For children in the remaining ZIP codes, health care providers should employ the CDC lead screening questionnaire to determine whether lead testing is needed. This will help to identify more children with low-level lead exposure, including BLLs greater than or equal to 3 μg/dL. The 20-quantiles can be consolidated into whichever larger risk categories are most helpful to health departments, pediatric practices, or community groups.

Limitations
In theory, all children whose parents responded “yes” or “don’t know” to any of the three questions on the CDC’s Clinical Lead Risk Assessment Questionnaire should have been tested for lead, but it is difficult to ascertain true practice at the time.42,43 Because BLL screening is not universal and only mandatory for children enrolled in Medicaid, the BLL screening records used in this study may not be representative of all at-risk children, creating potential for selection bias. This makes it more likely that we will recommend ZIP codes with high numbers of Medicaid-enrolled children as universal high-risk ZIP codes, potentially missing other high-risk ZIP codes and children.
Additionally, the adjusted R2 value of the selected model indicates that our model explains only 31% of the variance in BLLs at the ZCTA level. By scaling our model to the ZCTA level, we lost information available at the tax parcel unit level. Yet, the number of counties with available tax assessor data limits our ability to create a parcel-level model for the entire state. Still, all explanatory variables in the model are statistically significant and have the expected sign. Furthermore, this value is comparable to the R2 values of other models that use aggregated individual-level data.44,45 Despite these limitations, this analysis shows the usefulness of ZCTA-level information, particularly when individual or tax parcel unit-level data are not available.
Conclusions
The BLLs of children exposed to lead tend to increase during ages 0–2 years and peak at ages 18–24 months.46 Children enrolled in Medicaid are at high risk for lead exposure because they are more likely to live in older, poorly maintained homes that are more likely to contain lead paint.47 Children enrolled in Medicaid are required to receive blood lead tests at ages 12 months and 24 months or once if aged 24–72 months with no record of a previous blood lead test.4 For children not enrolled in Medicaid, the CDC recommends focusing efforts on high-risk neighborhoods and children.48 Clinicians can use the priority risk categorization presented here to flag high-risk ZIP codes in the medical record that trigger an assessment. The recommended vaccination schedule from birth through age 6 provides several opportunities for blood lead testing in a clinical setting.49 In addition to well-child visits, health care providers can also conduct blood lead tests at sick-child visits.43
The findings of this study demonstrate the utility of ZCTA-level census data in identifying high-risk ZIP codes for childhood lead exposure. Results of the ZCTA-level model are consistent with our previous findings at the tax parcel level but cover a wider geographic area. We identified six (of 20) quantiles, corresponding to 232 ZCTAs and 298 ZIP codes, as high-risk areas for childhood lead exposure. The model can be used at the state level to determine high-risk ZIP codes for universal testing. It can also be used by local health departments to tailor screening and testing strategies at the county level and can be used by clinicians to inform screening at well- and sick-child visits. Leveraging the availability of ZCTA-level census data, this approach can be replicated nationwide to achieve Healthy People 2030 objectives.
Acknowledgments
The authors thank Claire Osgood for her contributions to this project. Research reported in this publication was supported by the National Institute of Environmental Health Sciences of the National Institutes of Health under award number R01ES028819. The content is solely the responsibility of the authors and does not necessarily represent the official views of the National Institutes of Health. The findings and conclusions in this publication are those of the author(s) and do not necessarily represent the views of the North Carolina Department of Health and Human Services, Division of Public Health.
The authors have no conflicts of interest to declare.