1.
Drew R, Jones M. Geographic and Social Determinants of Community Pharmacy Closures in North Carolina (2018–2024). North Carolina Medical Journal. 2026;87(3).
Download all (2)
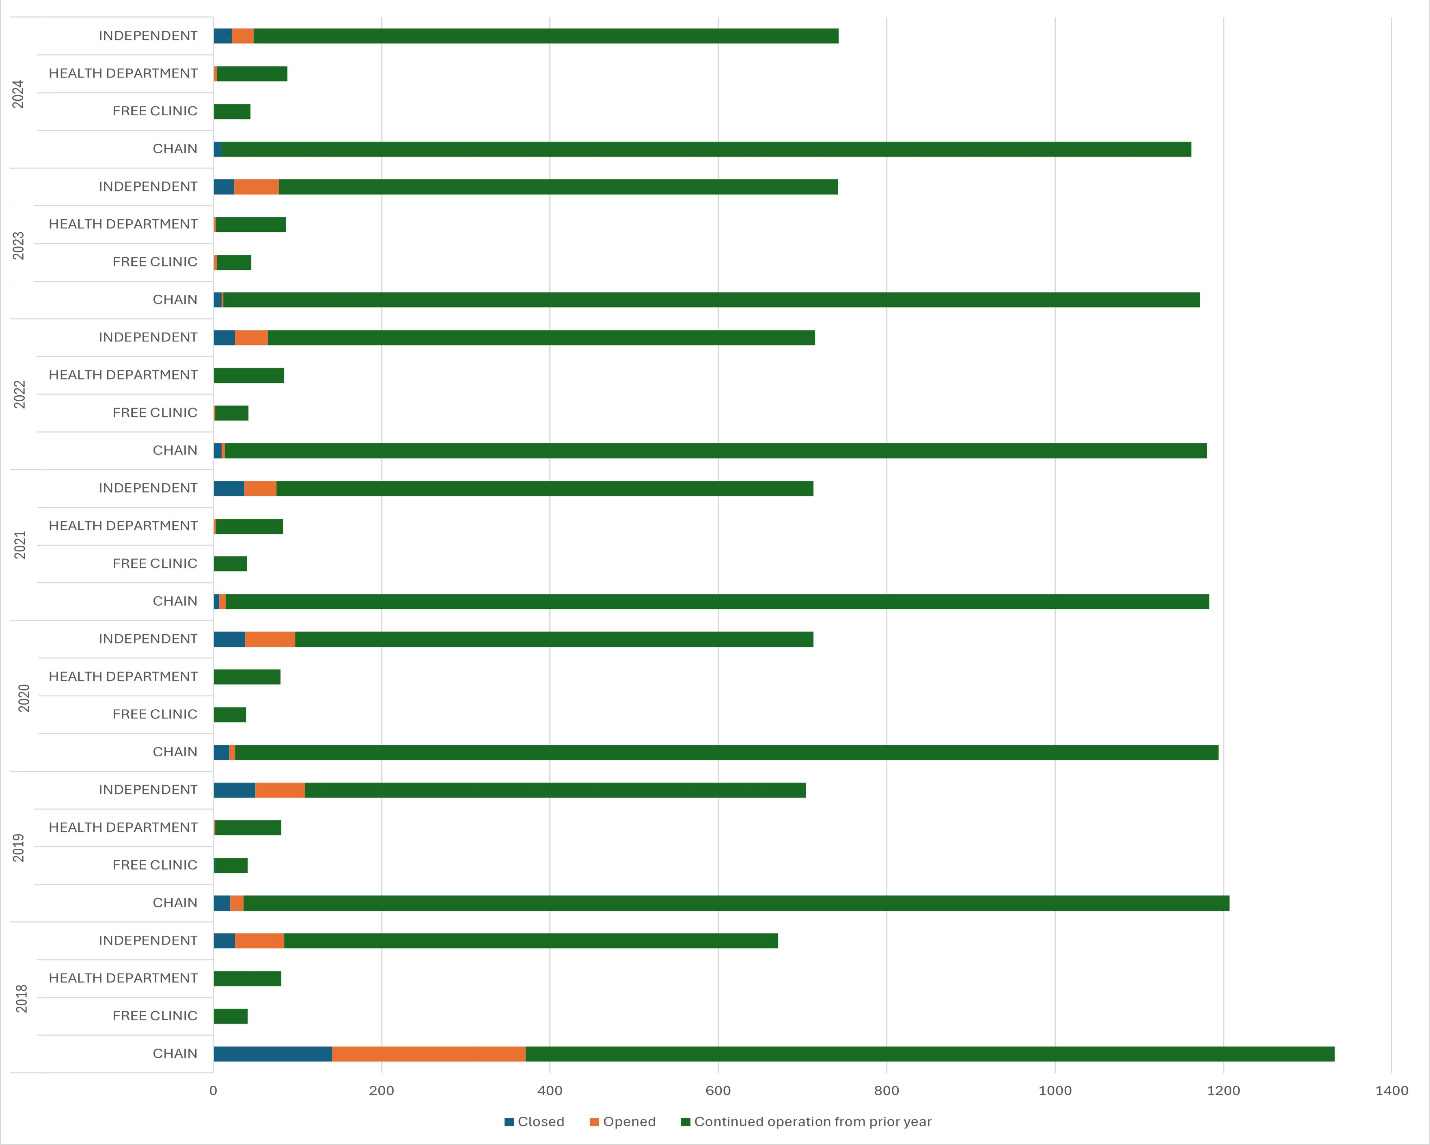
  • Figure 1. License Status by Year and Operation Type (2018–2024 End of Study)
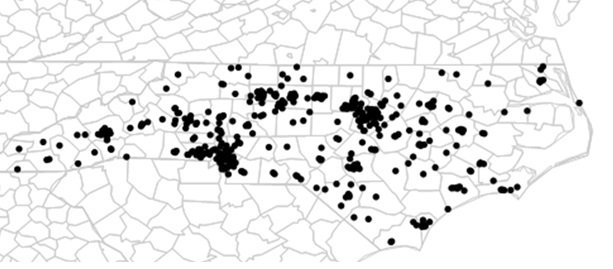
  • Figure 2. North Carolina Community Pharmacy Licensure Closures January 1, 2018–September 23, 2024, by County

Abstract

BACKGROUND

The closure of North Carolina community pharmacies threatens access to essential health care services.

METHODS

We sought to describe the rate of licensed North Carolina community pharmacy closures between 2018–2024. We also explored the association of operation type, geography, and social characteristics on the rate of such closures by end of study (EOS). Data from the North Carolina Board of Pharmacy identified community pharmacy operations in North Carolina between January 1, 2018–September 23, 2024 (inclusive). Data were combined with census and geographic data to describe licensure changes. The association of time-to-closure with operational type, rurality, Social Vulnerability Index (SVI), and medical services availability was explored utilizing a proportional hazards time-to-event survival analysis.

RESULTS

Existing (n = 1837) and new (n = 615) operations resulted in a total cohort of N = 2452. Of these, 448 (18.3%) had been closed by EOS, mostly from chain (1369 to 1152; 15.9% net loss) and independent (945 to 721; 23.7% net loss) operations. Of 615 new licenses, 193 (31.3%) were closed by EOS. Both independent operation and upper quartile of SVI (indicating the most vulnerable) were associated with closure by EOS (P values < .0001 and .0294, respectively). Only independent operation was associated with license duration in the multivariate model (P < .001).

LIMITATIONS

Data combined from a variety of public databases required use of asynchronous indices for some analyses. Data sources often utilize different geographic descriptors.

CONCLUSIONS

North Carolina community pharmacies are closing at an alarming rate. Such closures have the greatest impact on independent operations and in areas where the population is often the most vulnerable.

Introduction

Community-based pharmacies are the primary source of medications and health services for many individuals, including those with complex medical needs.1,2 They are particularly crucial for patients with chronic conditions who require ongoing medication management. However, notable increases in United States closures (including North Carolina) have substantial implications for patient access to medications, continuity of care, and overall health outcomes, particularly in underserved areas where alternative health care resources may be limited.3,4

Characterizing the communities most impacted by closures is essential for policymakers, health care providers, and public health officials aiming to ensure equitable access to pharmaceutical care across the state.5 This research aims to describe community pharmacy closures in North Carolina and examine the interplay between social and geographic characteristics on the rate of such closures.

Methods

The primary objective of this ecological retrospective cohort study was to describe the rate of licensed community pharmacy closures in North Carolina between 2018–2024. We also explored the association of pharmacy facility operation type, social determinants of health, rurality and health care availability on the duration of licensure. The protocol was reviewed and exempted as “not human subjects research” by the Duke University Hospital Institutional Review Board.

North Carolina Board of Pharmacy (NCBOP) licensure data as of September 23, 2024 (the date of request and download), were used to determine type, dates of operation, and physical location.6 To better identify those with physical facilities in North Carolina accessible to the public, we included only those in operation (as determined by a license active with the NCBOP) anytime between January 1, 2018, and September 23, 2024 (date of licensure query), with a primary state address of North Carolina and their facility operation described as one of the following: chain, free clinic, health department, or independent.

The facility’s primary address was used to determine Federal Information Processing Standards (FIPS) codes to uniquely identify geographic areas. For coordinates, the United States Census was used.7 In the case that the individual census tract was not retrieved, the census tract was identified using Geocodio.8 The locations were classified into 1 of 4 health care regions utilizing NC Health Care Regions designated by the North Carolina Department of Health and Human Services (NCDHHS) and comparable to North Carolina’s Public Health Preparedness and Response (PHP&R) Regions.9 Each location was classified as rural or urban using definitions used by the 2020 United States Census.10 This source defines an urban area as:

“…a densely settled core of census blocks that meet minimum housing unit density and/or population density requirements. This includes adjacent territory containing non-residential urban land uses. To qualify as an urban area, the territory identified according to criteria must encompass at least 2000 housing units or have a population of at least 5000.”

Urban areas were then determined by matching the FIPS code. Also, consistent with this definition, we defined those not included as rural.

The density of active community pharmacy licensures was determined by county area per 1000 mi2 and population density per 100,000 residents (respectively) utilizing North Carolina Census estimates for 2024 provided by the North Carolina Association of County Commissioners11 and the North Carolina Office of State Budget and Management (NCOSBM).12 To characterize community pharmacy licensure changes by county, we used the North Carolina demography breakdown by county reported in the 2023 American Community Survey (ACS) 5-year estimates data.13 Based on data from prior published investigations, we explored subgroups disproportionally and negatively impacted by community pharmacy closures. For determination of the density (by county area and population) of those aged > 65 years old (due to high medication use), we utilized the National Health Interview Survey and the 2021 and 2022 North Carolina Department of Health and Human Services (NCDHHS) National Health Interview Survey.14,15

For determination of traditionally underrepresented races, we used the following classifications for racial and/or ethnic minority populations, as defined by the United States Office of Management and Budget, Directive 15, designated by the NIH-Designated Populations with Health Disparities: American Indian or Alaska Native, Asian, Black or African American, Hispanic or Latino, and Native Hawaiian or Pacific Islander.16 While those of Middle Eastern or North African decent were included in the NIH-designated populations, they were not characterized in the 2023 ACS survey and therefore were excluded in our analysis.

Social vulnerability by census tract was classified utilizing the Social Vulnerability Index (SVI).17 This includes considerations of 16 census-based variables grouped into 4 domains—socioeconomic status, household characteristics (including age > 65 years), racial and ethnic minority status, and housing type/transportation. “RPL_THEMES” was the SVI ranking variable for overall vulnerability. Each included pharmacy was matched by FIPS coding to the SVI. To classify those with the greatest vulnerability, the corresponding SVI value for all North Carolina census tracts (independent of cohort inclusion) was used to determine the distribution of scores within the state. Cohort values within the upper quartile were classified as the highest social vulnerability (since decimal scores closest to 1 indicate highest need). The median (IQ25,75) SVI score for all 2640 North Carolina census tracts (excluding 20 missing values) used to determine the upper quartile was 0.5002 (IQ25,75: 0.2501, 0.7503).

To examine the impact of health care services, we used the Medically Underserved Areas/Populations (MUAs/MUPs) designations at the state and county level for primary care utilizing 6-digit FIPS codes.18 Areas designated as a Medically Underserved Area, Medically Underserved Area—Governor’s Exception, or Medically Underserved Population were classified as a “Medically Underserved Area/Population” (MUA/P).

We identified community pharmacies operating as the sole facility within a geographic area (defined as the only pharmacy within a ZIP code, excluding those where pharmacies exist within the same primary city address). Descriptive statistics were also used to summarize the characteristics of pharmacies prior to closure, including location, type (independent versus chain), and both demographic and geographic information of the surrounding community. Data were plotted to visually explore trends over time, including geomapping. North Carolina ZIP codes were obtained from the United States Postal Service (USPS).19 ZIP code mapping coordinates (2020) were obtained from census.gov.20

We investigated community and social characteristics related to licensure status at the end of the study utilizing Chi square and Fisher’s exact test (2-tailed). To explore the association of social vulnerability (using SVI), medical services (MUA/P), geography (rurality), and independent facility operation on the rate of pharmacy closures, we conducted survival analyses utilizing a proportional hazards model. For each operation included, we determined the licensure duration (time-to-event [closure]) and utilized this in the survival analysis. For those licensed prior to the study period, time was determined from the start of the study period (January 1, 2018) to the closure date or the end of the study period (September 23, 2024), whichever came first. For operations licensed after the start of the study, we utilized the date of licensure to the closure date or the end of the study period (September 23, 2024). A rolling entry based on licensing date was used. Pharmacies that opened prior to 2018 entered the models that year; pharmacies that newly opened between 2018 and 2024 EOS entered the models in the year of the opening. Those pharmacies with active licenses as of September 23, 2024, were right censored for survival analysis. Univariate analysis was conducted for each potential predictor. Predictors considered statistically significant (P < .05) were evaluated for effect modification. Data were stored and analyzed utilizing JMP19 Pro (v17.2.0, SAS Institute Inc., Cary, NC, 1989–2024).

Results

Of the 8919 licenses identified by the NCBOP, a total of N = 2452 were included in this study. Reasons for exclusions include the following (multiple may apply): license other than pharmacy (n = 2585); operation not a targeted community setting (n = 5790); outside years of study inclusion (n = 2975); and/or primary (physical) address not within North Carolina (n = 2740). Among the total included cohort, most were operating as a chain (n = 1369; 55.8%) or independent (n = 945; 38.5%), located in urban settings (n = 1422; 58.0%), and within the Central District (n = 994; 40.5%). A total of 944 (38.5%) served in counties designated as Medically Underserved Areas or Populations (MUA/P). In addition, 884 (36%) operated in an area of highest social vulnerability.

From 1837 licensed community operations at the beginning of the study, 615 were newly licensed during the study and 448 closed during the study, for a net gain of 167 and a total of 2004 active licenses at the end of the study. By 2024, end of study (September 23, 2024, EOS), the total number of active North Carolina community pharmacy licensures in the cohort was n = 2004, representing a net gain of 167 active licenses (9.1%) from the 1837 active licenses at the beginning of the study. Pharmacy closures from the entire study cohort totaled 448 operations (–18.3%). Most of this change came from the reduction in independent (945 to 721; 23.7% net loss) and chain (1369 to 1152; 15.9% net loss) pharmacies (Table 1 and Figure 1).

Table 1.License Status by Year and Operation Type (2018–2024 End of Study)
Operation
Type
Entry Cohort as of 1/1/2018a Licensures at End of Year: New / Closed (total by facility operation), n Total Cohort (all years)
2018 2019 2020 2021 2022 2023 2024 (EOS)b
Chain 1102 230/141c
(1191)
16/20
(1187)
7/19
(1175)
8/7
(1176)
4/10
(1170)
2/10
(1162)
0/10
(1152)
1369
Free clinic 41 0/0
(41)
0/2
(39)
0/0
(39)
1/0
(40)
2/0
(42)
3/1
(44)
0/0
(44)
47
Health department 81 0/1
(80)
1/1
(80)
0/0
(80)
3/0
(83)
1/0
(84)
2/1
(85)
3/1
(87)
91
Independent 613 58/26
(645)
59/50
(654)
59/38
(675)
38/37
(676)
39/26
(689)
53/25
(717)
26/22
(721)
945
Total active 1837 1957 1960 1969 1975 1985 2008 2004 2452
Total open/closed – 288/168 76/73 66/57 50/44 46/36 60/37 29/33 –

a Active community pharmacy license started prior to and/or on January 1, 2018.
b As of September 23, 2024.
c Rite Aid acquisition by Walgreens contributed substantially to 2018 chain openings (98 Walgreen operations) and closures (116 Rite Aid operations).

Figure 1
Figure 1.License Status by Year and Operation Type (2018–2024 End of Study)

Figure note. Rite Aid acquisition by Walgreens contributed substantially to 2018 chain openings (98 Walgreen operations) and closures (116 Rite Aid operations).

The rate of new licensures generally declined during the study period. From 2019–2024 YTD, new licenses dropped steadily each year (76 in 2019; 29 in 2024 EOS). Of the 615 new licenses within the total cohort, 193 (31.3%) were closed by EOS (137 chain and 56 independent) (Figure 1). The locations of the closed community pharmacy operations within North Carolina over the study period are illustrated in Figure 2. Among the 448 closures, most were independent operations (50%) in urban areas (60.5%) within the Central Health Region (42.2%).
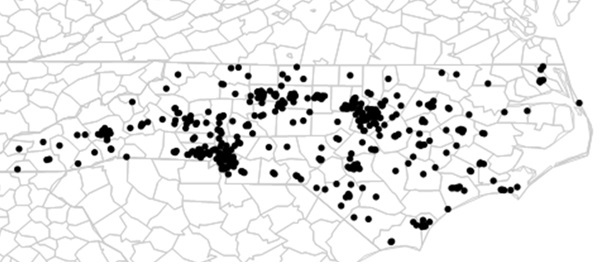
Figure 2
Figure 2.North Carolina Community Pharmacy Licensure Closures January 1, 2018–September 23, 2024, by County

Figure note. This map was plotted from geographic coordinates utilizing JMP19 Pro (v17.2.0, SAS Institute Inc., Cary, NC, 1989–2024).

Results of the exploration of association of social vulnerability (SVI; ADI), medical services (MUA/P; HPSA), geography (rurality), and independent facility operation on closure status at EOS (summarized in Table 2) revealed that both operation type and SVI were associated with closure (P values < .0001 and .0294, respectively). Results of the impact of community and social characteristics on licensure duration are summarized in Table 3. While independent operation and high social vulnerability (SVI index in the upper quartile) were statistically significant in the univariate analysis, only independent operation remained statistically significant in the multivariate model.

Table 2.License Status at End of Study (EOS) by Facility Characteristics
– Active EOS Closed EOS Total Cohort P value
– n % n % n % –
Operation – < .0001a
Chain 1152 57.49 217 48.44 1369 55.83 –
Free clinic 44 2.20 3 0.67 47 1.92 –
Health department 87 4.34 4 0.89 91 3.71 –
Independent 721 35.98 224 50.00 945 38.54 –
–
Rurality – .2350
Rural 853 42.56 177 39.51 1030 42.01 –
Urban 1151 57.44 271 60.49 1422 57.99 –
–
NCDHHS Regions – Not tested
Central 805 40.17 189 42.19 994 40.54 –
CRI 500 24.95 113 25.22 613 25.00 –
Eastern 437 21.81 101 22.54 538 21.94 –
Western 262 13.07 45 10.04 307 12.52 –
–
MUA/P Category – .7086a
MUA/P 775 38.67 169 37.72 944 38.50 –
Not MUA/P-designated 1229 61.33 279 62.28 1508 61.50 –
–
SVI – .0294b
SVI Q1-3 quartile for NC (less vulnerable) 1302 64.97 266 59.38 1568 63.95 –
SVI Q4 upper quartile for NC (most vulnerable) 702 35.03 182 40.63 884 36.05 –
– – – – – – – –
Total 2004 81.73 448 18.27 2452 – –

Table note. a Chi square by likelihood ratio; b Fisher’s exact test (2 tailed)
EOS = end of study; MUA/P = Medically Underserved Area/Population; NCDHHS = North Carolina Department of Health and Human Services; SVI = Social Vulnerability Index.
The distribution of SVI for all 2640 North Carolina census tracts (excluding 20 missing values) used to determine the upper quartile was a median SVI of 0.5002 (IQ25,75: 0.2501, 0.7503).

Table 3.Impact of Community and Social Characteristics on Licensure Duration
Characteristic Chi-square
(P value)
Proportions Hazards Model
Univariate Multivariate
Hazard Ratio 95% CI P value Hazard Ratio 95% CI P value
Rural 1.4645 (.2262) 0.8895144 0.736013, 1.0750297 .2257 0.8879277 0.7300985, 1.0798757 .2339
Independent Operation 21.7511
(< .0001a)
1.6517151 1.3691965, 1.9925284 < .0001 1.6678738 1.3788034, 2.0175487 < .0001
SVI Upper Quartile 4.4901 (.0341a) 1.225229 1.0146796, 1.479468 .0347 1.1595564 0.9536213, 1.4099633 .1378
Medically Underserved 0.4008 (.5267) 0.9577622 0.7911962, 1.1593943 .6580 0.8920862 0.7329693, 1.0857449 .2546

a Wilcoxon test.

Data regarding changes in licensure density by North Carolina Department of Health and Human Services (DHHS) region are summarized in Table 4. The median relative change in licensures per 100,000 population ranged from –3.49 (CRI [Cities Readiness Initiative] Region) to 9.43 (Western Region). However, there were notable variations in the rate within each district. Counties most impacted (based on licensure per 100K population) were Swain, Jones, Currituck, Graham, Franklin, and Clay, with changes ranging from 48.6 to –30.0 (Appendix A).

Table 4.Change in Licensure Density by North Carolina Department of Health and Human Services (NCDHHS) Region
NCDHHS Region Change Per 100K Population, Absolute (n) Change Per 100K Population,
Relative (%)
Change Per 1000 mi2,
Absolute (n)
Change Per 1000 mi2,
Relative (%)
Median IQ25 IQ75 Median IQ25 IQ75 Median IQ25 IQ75 Median IQ25 IQ75
Central 0.22 –0.80 2.31 2.43 –3.72 15.19 1.81 0.00 3.92 4.17 0.00 16.67
CRI Region –0.61 –1.41 1.51 –3.49 –6.98 9.80 5.03 0.00 7.85 8.33 0.00 13.51
Eastern 0.89 –0.59 6.89 7.94 –3.05 24.34 0.00 0.00 3.40 0.00 0.00 17.16
Western 1.81 –3.86 3.50 9.43 –16.44 21.24 2.26 –1.92 4.01 10.56 –10.83 20.79

Table note. Overall, the change in licensure density was a median (IQ25, IQ75) of 3.99 (–3.91, 19.49).
IQ25, IQ75 = 25th and 75th interquartile range.
DHHS Regions include the following counties:
Central Region: Alamance, Caswell, Chatham, Davidson, Davie, Durham, Edgecombe, Forsyth, Franklin, Granville, Guilford, Halifax, Harnett, Johnston, Lee, Montgomery, Moore, Nash, Northampton, Orange, Person, Randolph, Richmond, Rockingham, Scotland, Stokes, Surry, Vance, Wake, Warren, Wilson, Yadkin.
CRI Region: Anson, Cabarrus, Catawba, Cleveland, Gaston, Iredell, Lincoln, Mecklenburg, Rowan, Stanly, Union.
Eastern Region: Beaufort, Bertie, Bladen, Brunswick, Camden, Carteret, Chowan, Columbus, Craven, Cumberland, Currituck, Dare, Duplin, Gates, Greene, Hertford, Hoke, Hyde, Jones, Lenoir, Martin, New Hanover, Onslow, Pamlico, Pasquotank, Pender, Perquimans, Pitt, Robeson, Sampson, Tyrrell, Washington, Wayne.
Western Region: Alexander, Alleghany, Ashe, Avery, Buncombe, Burke, Caldwell, Cherokee, Clay, Eastern Band of Cherokee Indians, Graham, Haywood, Henderson, Jackson, Macon, Madison, McDowell, Mitchell, Polk, Rutherford, Swain, Transylvania, Watauga, Wilkes, Yancey.

We identified community pharmacies operating as the sole facility within a geographic area (defined as the only pharmacy within a ZIP code, excluding those where pharmacies exist within the same primary city address). In this study, 99 (4%) of the active pharmacies licensed in the study period qualified as sole pharmacies. Of these, 48.5% were in rural areas, despite only 25% of the total cohort pharmacies being in rural settings. However, closures of sole pharmacies were disproportionately observed in urban areas, with 25.5% of sole pharmacies in urban settings closing, compared to only 10.4% in rural areas. Among the 801 North Carolina physical ZIP code locations, 399 (49.8%) had no licensed community pharmacies, increasing to 417 (52.1%) in 2024 EOS.

Counties with the highest concentration of populations disproportionately impacted by closures are also included in Appendix A. The median (IQ~25, 75~) percentage of a population (by county) aged > 65 years was 21% (17%, 24%). Populations by county with more than 24% of people aged > 65 years were within the upper quartile for the state. Racial minorities thought at greatest risk of health disparities made up a median (IQ25,75) of 29% (14%, 45%); those > 45% were within the upper quartile.

Discussion

Despite a net gain of 9.1% from pharmacies open at the start until the EOS, there were 448 closures, representing an 18.3% reduction in community pharmacy operations. Most closures were observed in chain (a net loss of 15.9%, from 1369 to 1152 pharmacies) and independent pharmacies (a net loss of 23.7%, from 945 to 721 pharmacies). The closures reported in this study are in line with those documented in previous research, which also highlighted substantial state and regional variations.3,21,22 Additionally, a general decline in new licenses was observed over the study period, with the number of new licenses dropping from 76 in 2019 to only 29 by 2024 (excluding the last 3 months). By the end of the study, 31.3% of the 615 new licenses had already closed. The bankruptcy of the Rite Aid chain and its acquisition by Walgreens in 2018 was especially impactful on both openings (98 Walgreen operations) and closures (116 Rite Aid operations). Impending closures from major chains like Walgreens (1200 planned closures) and CVS (4000 proposed layoffs) are expected to intensify the issue.23 According to a National Pharmaceutical Association survey in February 2024, 32% of independent pharmacy owners and managers are considering closing their operations within the year due to these financial pressures.24

In our study, independent pharmacy operation was associated with a more rapid time to closure (hazard ratio [HR] 1.67; 95% confidence interval [CI], 1.38–2.02; P < .001) when compared to other operations. Prior studies have also reported an association of independent operation and closure.3,22,25–27 Independent pharmacies often serve smaller, more rural communities and face greater economic challenges compared to chain pharmacies, which benefit from larger economies of scale. However, these independent operations are more susceptible to financial strain, increased market competition, and regulatory pressures, making them vulnerable to closure.28

Sole pharmacies constituted 4% of licensures and disproportionately impacted urban areas. Others have considered geographic distance (such as 10 miles between pharmacies in rural areas) for their evaluations.29–33 Operations similar to sole pharmacies have been referred to as “keystone” if their operation prevented the creation of what is often referred to as a “pharmacy desert.” In one study, 883,437 people (8.51% of the North Carolina population) rely on a keystone pharmacy.21 Despite several challenges in utilizing an endpoint such as “pharmacy deserts” (since it is arbitrarily based largely on drive times and varies in definition between studies), many of these studies help define the impact of pharmacy closures.4,21,22,34–36 Nationally, 15.8 million people (4.7%) in the United States live in pharmacy deserts.34 Others have described similar data, with 3.72% of United States census tracts classified as pharmacy deserts, comprising more than 10 million inhabitants (3.1% of the United States population).37 Nearly 46% of United States counties had at least one pharmacy desert.38 In North Carolina, a previous study reporting data on 2002 North Carolina pharmacies identified 337 census tracts as pharmacy deserts.4 In that report, 17.2% and 4.25% of urban and rural census tracts (respectively) met their definition of pharmacy deserts.

We observed a higher percentage of licensure closures among pharmacies serving areas with the most socially vulnerable population. This, too, was consistent with prior studies, including one focusing on North Carolina.4,38–40 Higher SVI has been linked with increased health care spending and patient-reported barriers to care due to cost.41 In contrast, we were unable to detect a relationship between a community pharmacy located within a Medically Underserved Area/Medically Underserved Population (MUA/P)-designated area to either rate or time to facility closure. A total of 944 (38.5%) pharmacies in our pharmacy cohort were located within a current MUA/MUP or Health Professional Shortage Area (HPSA); this compares to a prior study of the US population reporting this proportion to be 56% for the subset of community pharmacies studied.42 However, the percentage differs widely between states. In a prior report, 1770 / 2352 (75.26%) of North Carolina pharmacies were within either an MUA/P or HPSA.42

While absolute numbers of new licensures and closures capture overall state impact, they may not accurately describe impact on select geographic areas due to population shifts in both density and demography. Shifts in the United States population have led to an increasing population in rural communities.43 Rural populations are particularly affected by the shortage of health care workers, which disproportionately impacts these areas. According to the World Health Organization’s guidelines on workforce development in rural and remote areas, this shortage is a substantial concern.44 As of April 1, 2020, North Carolina had the second-largest rural population in the United States by percentage, according to the North Carolina Office of State Budget and Management (NCOSBM).45 In our study, rural and non-rural areas represented 42.01% and 57.99% of the cohort, respectively. While we did not observe statistically significant differences in time to pharmacy closures between these groups, the closures were more likely to occur in urban areas, consistent with previous reports.3,21 This finding can be explained (at least in part) by the higher concentration of chain pharmacies in these areas impacted by corporate closures.

To better characterize changes in community pharmacy licensures by geography and population density, we included descriptions of licensure density by county area and population over time. This would be especially relevant given notable shifts and growing numbers of the North Carolina population. North Carolina’s population grew 3% from the 10.4 million people who lived there in 2018 to 10.6 million in 2022. We discovered substantial variation in the changes in licensure density by both population and geographic density (Appendix A).

While some indices (such as SVI) include a variety of social characteristics, they may not provide the details and/or adjustments for changes in population segments utilizing community pharmacy services most often (i.e., high-use groups). Older patients may utilize community pharmacy services for medication management for chronic conditions, while minority populations may utilize community pharmacy services to address their lack of access to other health care services.46 Between 2018 and 2022, the Hispanic/Latino population had the most growth, increasing by 129,104 people, from 992,905 in 2018 to 1.1 million in 2022. Among 6 age groups, the 65+ group in North Carolina was the fastest growing between 2018 and 2022, with its population increasing 10.2%.47 Projections from the North Carolina Office of State Budget and Management estimate a 21% increase in North Carolina by 2043.48 United States community pharmacies are often the most accessible health care providers in underserved communities. Therefore, closures may further widen health care disparities for these patients.49 Such disparities have been noted within the North Carolina Health Disparities Analysis Report.50

We feel the present study provides unique insight into the magnitude and distribution of pharmacy closures within North Carolina and the widely varying impact it has on many of the state’s counties. Such information is vital to statewide planning to mitigate this problem. However, there are limitations worth noting. Our licensure data for 2024 excluded the final 3 months, since the data query included licensure information up to the date of query. We used data to the census tract level (when available) and the indices only within our cohort period. We combined data from a variety of public databases capturing information from various time intervals (as noted in our methods description), introducing the potential for asynchronous indices. Many of these data sources were available utilizing different geographic descriptors. Such analyses may miss differences between neighborhoods within the same “community.” Finally, while both the COVID-19 pandemic and Hurricane Helene (in Western North Carolina) may have substantially impacted closure rates, we did not analyze their impact.

Conclusion

While the overall number of North Carolina community pharmacies showed a net gain between 2018 and 2024 EOS, this tended to mask community-level changes (which varied widely among the areas studied). In the nearly 6-year span, we noted a substantial decline in community pharmacy operations, new licensures, and short license lifespans (especially among those newly licensed within the study period), impacting independent operations and areas most socially vulnerable. This study highlights the urgent need for solutions which support community pharmacy services.5,51 Potential solutions include the use of innovative pharmacy service models, continued legislative reform regarding Pharmacy Benefit Managers (PBM), Medicaid and Medicare policy adjustments, incentives for public-private partnerships, and alternate purchasing models.5 As closures continue to rise, there is growing concern about the broader impact on community health, access, and medication adherence.


Acknowledgments

We would like to thank Dr. Peter Ahiawodzi for his review of our study manuscript.

Financial Support

Funding for NC Board of Pharmacy licensure data was provided by the Department of Pharmacy Practice, Campbell University College of Pharmacy & Health Sciences, Buies Creek, North Carolina.

Correspondence

Address correspondence to Dr. Richard Drew, Duke University School of Medicine, Box 102359, Durham, NC 27710 (richard.drew@duke.edu).

References

1.
Eddy E, Ballou JM, Finke JB, et al. Medication therapy management: The evolution of clinical pharmacy services in U.S. community-based pharmacy practice—An opinion of the Community-based practice and research network of the American College of Clinical Pharmacy. J Am Coll Clin Pharm. 2024;7(12):1228-1234. doi:10.1002/​jac5.2047
Google Scholar
2.
Carroll JC, Doong K, Mitra S, McGivney MS, McGrath SH, Coley KC. Complexity of patient encounters within a clinically integrated community pharmacy network Medicaid payer program. J Am Pharm Assoc (2003). 2025;65(1):102264. doi:10.1016/​j.japh.2024.102264
Google Scholar
3.
Guadamuz JS, Alexander GC, Zenk SN, Qato DM. Assessment of pharmacy closures in the United States From 2009 through 2015. JAMA Intern Med. 2020;180(1):157-160. doi:10.1001/​jamainternmed.2019.4588
Google Scholar
4.
Poondi N, Douglas A, McDaniel P, et al. Mapping pharmacy deserts in North Carolina: A geospatial analysis and its implications for University of North Carolina Health’s catchment population. J Am Pharm Assoc (2003). Published online 2024:102215. doi:10.1016/​j.japh.2024.102215
Google Scholar
5.
Drew RH. A silent health care emergency: The disappearance of North Carolina community pharmacies. NC Med J. 2025;86(2):142168. doi:10.18043/​001c.142168
Google Scholar
6.
North Carolina Board of Pharmacy licensure data. North Carolina Board of Pharmacy. Accessed September 23, 2024. https:/​/​portal.ncbop.org/​Verification/​roster.aspx
7.
US Census batch geography. United States Census Bureau. Accessed October 15, 2024. https:/​/​geocoding.geo.census.gov/​geocoder/​geographies/​addressbatch?form
8.
U.S. Census identifiers (FIPS/GeoID). Geocodio. Accessed October 15, 2024. https:/​/​www.geocod.io/​
9.
Public health preparedness & response regions. North Carolina Department of Health and Human Services. September 10, 2020. Accessed November 11, 2024. https:/​/​epi.dph.ncdhhs.gov/​phpr/​regions.html#list
10.
Urban and rural. United States Census Bureau. Accessed November 21, 2024. https:/​/​www.census.gov/​programs-surveys/​geography/​guidance/​geo-areas/​urban-rural.html
11.
County data and information. North Carolina Association of County Commissioners. Accessed January 9, 2025. https:/​/​www.ncacc.org/​research-and-publications/​research/​county-data-and-information/​
12.
County/state population projections. North Carolina Office of State Budget and Management. January 9, 2025. https:/​/​www.osbm.nc.gov/​facts-figures/​population-demographics/​state-demographer/​countystate-population-projection
13.
ACS: Demographic and housing estimates. United States Census Bureau. Accessed January 16, 2025. https:/​/​data.census.gov/​table/​ACSDP5Y2023.DP05?g=040XX00US37$0500000&y=2023
14.
CDC. QuickStats: Percentage of adults aged ≥18 years who were prescribed medication in the past 12 months by sex and age group - National Health Interview Survey, 2017. MMWR Morb Mortal Wkly Rep. 2019;68(4):97. doi:10.15585/​mmwr.mm6804a6
Google Scholar
15.
Race and ethnicity by county, July 1, 2022 NC population estimates. North Carolina Department of Health and Human Services. Accessed January 15, 2025. https:/​/​www.ncdhhs.gov/​2022-ethnicity-and-racial-data-nc-county/​download?attachment
16.
NIH-designated populations with health disparities. National Institute on Minority Health and Health Disparities. Accessed August 19, 2025. https:/​/​www.nimhd.nih.gov/​about/​nih-designated-populations-health-disparities
18.
Find MUA/P. Health Resources and Services Administration. Accessed November 12, 2024. https:/​/​data.hrsa.gov/​topics/​health-workforce/​shortage-areas/​mua-find
19.
ZIP codes by area and district codes. United States Postal Service. Accessed December 12, 2024. https:/​/​postalpro.usps.com/​ZIP_Locale_Detail
20.
2020 TIGER/Line® shapefiles: ZIP code tabulation areas. United States Census Bureau. Accessed December 17, 2024. https:/​/​www.census.gov/​cgi-bin/​geo/​shapefiles/​index.php?year=2020&layergroup=ZIP%20Code%20Tabulation%20Areas
21.
Mathis WS, Berenbrok LA, Kahn PA, Appolon G, Tang S, Hernandez I. Vulnerability Index approach to identify pharmacy deserts and keystone pharmacies. JAMA Netw Open. 2025;8(3):e250715. doi:10.1001/​jamanetworkopen.2025.0715
Google Scholar
22.
Guadamuz JS, Alexander GC, Kanter GP, Qato DM. More US pharmacies closed than opened in 2018-21; Independent pharmacies, those in Black, Latinx communities most at risk. Health Aff (Millwood). 2024;43(12):1703-1711. doi:10.1377/​hlthaff.2024.00192
Google Scholar
23.
Lin-Fisher B. More pharmacy closures leave consumers in pharmacy deserts without access to medications. USA Today. October 18, 2024. Accessed March 27, 2025. https:/​/​www.usatoday.com/​story/​money/​2024/​10/​18/​what-is-a-pharmacy-desert/​75700235007/​
24.
National Community Pharmacists Association. Report for February 2024 Survey of Independent Pharmacy Owners/Managers.; 2024. Accessed January 6, 2025. https:/​/​ncpa.org/​sites/​default/​files/​2024-02/​Feb2024-DIRsurvey.Exec%20Summary.pdf
25.
Qato DM, Alexander GC, Chakraborty A, Guadamuz JS, Jackson JW. Association between pharmacy closures and adherence to cardiovascular medications among older US adults. JAMA Netw Open. 2019;2(4):e192606. doi:10.1001/​jamanetworkopen.2019.2606
Google Scholar
26.
Anderson KE, Sahu M, DiStefano MJ, Asche CV, Mattingly TJ 2nd. Pharmacy closures and anticonvulsant medication prescription fills. JAMA. 2024;332(21):1847-1849. doi:10.1001/​jama.2024.19993
Google Scholar
27.
Mattingly TJ 2nd, Sahu M, Anderson KE. Community pharmacy turnover and context of openings and closings by ownership type. JAMA Health Forum. 2025;6(8):e251988. doi:10.1001/​jamahealthforum.2025.1988
Google Scholar
28.
Hernandez I, Tang S, Morales J, et al. Role of independent versus chain pharmacies in providing pharmacy access: A nationwide, individual-level geographic information systems analysis. Health Aff Sch. 2023;1(1):qxad003. doi:10.1093/​haschl/​qxad003
Google Scholar
29.
Freeman V, Richardson I, Slifkin R. Sole Community Pharmacies and Part D Participation: Implications for Rural Residents. NC Rural Health Research & Policy Analysis Center; 2009. Accessed November 19, 2025. https:/​/​www.shepscenter.unc.edu/​wp-content/​uploads/​2014/​10/​FB87.pdf
30.
Klepser D, Lampman M, Radford A, Richardson I, Rutledge S. Workforce Issues Among Sole Community Pharmacies. Sheps Center; 2009. Accessed November 19, 2025. https:/​/​www.shepscenter.unc.edu/​wp-content/​uploads/​2014/​10/​FB89.pdf
31.
Mueller K, Todd K, Ullrich F. Pharmacy Services in Communities After the Only Local Pharmacy Closes. Rural Health Research Gateway. 2013. Accessed November 19, 2025. https:/​/​www.ruralhealthresearch.org/​projects/​651
32.
Nattinger M, Ullrich F, Mueller K, et al. Characteristics of rural communities with a sole, independently owned pharmacy. Rural Policy Brief. 2015;6:1-4. PMID:26793812
Google ScholarPubMed
33.
Radford A, Richardson I, Mason M, Rutledge S. The Key Role of Sole Community Pharmacists in Their Local Healthcare Delivery Systems. Sheps Center; 2009. Accessed March 30, 2026. https:/​/​www.shepscenter.unc.edu/​wp-content/​uploads/​2014/​10/​FB88.pdf
34.
Wittenauer R, Shah PD, Bacci JL, Stergachis A. Locations and characteristics of pharmacy deserts in the United States: A geospatial study. Health Aff Sch. 2024;2(4):qxae035. doi:10.1093/​haschl/​qxae035
Google Scholar
35.
Kelly C, Hulme C, Farragher T, Clarke G. Are differences in travel time or distance to healthcare for adults in global north countries associated with an impact on health outcomes? A systematic review. BMJ Open. 2016;6(11):e013059. doi:10.1136/​bmjopen-2016-013059
Google Scholar
36.
Sharareh N, Tang S, Bress A, Mathis WS, Berenbrok LA, Hernandez I. Geographic access to community pharmacies based on walking, driving, and public transportation in the 10 most populated U.S. areas. J Am Pharm Assoc (2003). 2025;65(6):102479. doi:10.1016/​j.japh.2025.102479
Google Scholar
37.
Catalano G, Woldesenbet S, Pawlik TM. Distribution of pharmacy deserts and its association with digital divide and residential redlining across the United States. PLoS One. 2025;20(8):e0330027. doi:10.1371/​journal.pone.0330027
Google Scholar
38.
Catalano G, Khan MMM, Chatzipanagiotou OP, Pawlik TM. Pharmacy accessibility and social vulnerability. JAMA Netw Open. 2024;7(8):e2429755. doi:10.1001/​jamanetworkopen.2024.29755
Google Scholar
39.
Appolon G, Tang S, Gabriel N, et al. Racial and ethnic inequities in spatial access to pharmacies: A geographic information system analysis. J Am Pharm Assoc (2003). 2024;64(4):102131. doi:10.1016/​j.japh.2024.102131
Google Scholar
40.
Adepoju OE, Kiaghadi A, Shokouhi Niaki D, Karunwi A, Chen H, Woodard L. Rethinking access to care: A spatial-economic analysis of the potential impact of pharmacy closures in the United States. PLoS One. 2023;18(7):e0289284. doi:10.1371/​journal.pone.0289284
Google Scholar
41.
Morenz AM, Liao JM, Au DH, Hayes SA. Area-level socioeconomic disadvantage and health care apending: A systematic review. JAMA Netw Open. 2024;7(2):e2356121. doi:10.1001/​jamanetworkopen.2023.56121
Google Scholar
42.
Murphy EM, West L, Jindal N. Pharmacist provider status: Geoprocessing analysis of pharmacy locations, medically underserved areas, populations, and health professional shortage areas. J Am Pharm Assoc (2003). 2021;61(6):651-660.e1. doi:10.1016/​j.japh.2021.08.021
Google Scholar
43.
Davis JC, Cromartie J, Farrigan T, Genetin B, Sanders A, Winikoff JB. Rural America at a Glance: 2023 Edition. U.S. Department of Agriculture, Economic Research Service; 2023. doi:10.32747/​2023.8134362.ers
44.
World Health Organization. WHO Guideline on Health Workforce Development, Attraction, Recruitment and Retention in Rural and Remote Areas. World Health Organization; 2021. https:/​/​www.who.int/​publications/​i/​item/​9789240024229
45.
Cline M. 15 things we learned from the new 2020 Census data. North Carolina Office of State Budget and Management. May 25, 2023. Accessed March 31, 2025. https:/​/​www.osbm.nc.gov/​blog/​2023/​05/​25/​15-things-we-learned-new-2020-census-data
46.
Ortega M, Isom C, Place A, et al. ASHP statement on the community pharmacist’s role in the care continuum. Am J Health Syst Pharm. 2024;82(1):96-102. doi:10.1093/​ajhp/​zxae176
Google Scholar
48.
Division of Aging. North Carolina’s Aging Population. North Carolina Department of Health and Human Services; 2025. Accessed November 19, 2025. https:/​/​www.ncdhhs.gov/​2023-north-carolina-aging-profile-slide-deck-0/​open
49.
Hughes TD, Roller JS, Hahn F, Ferreri SP. Racial and ethnic disparities in community-based pharmacies: A scoping review. Pharmacy (Basel). 2023;11(3):93. doi:10.3390/​pharmacy11030093
Google Scholar
51.
Bacci JL, Carroll JC, Coley KC, et al. Act for the future of community pharmacy. J Am Pharm Assoc (2003). 2025;65(1):102256. doi:10.1016/​j.japh.2024.102256
Google Scholar

Appendix A.

Area, Population, and Licensure by North Carolina Department of Health and Human Services (NCDHHS) Region and County
Region County County
Area (m2)
Population
(2018)
Active
Licenses
(2018)
Population
(2024)
Active Licenses
(2024)
Relative Active Licensure Change
Per 100K Population (%)
Relative Active Licensure Change Per 1000 mi2 (%) Minority Populationb
( %)
65 years and
older populationa
(%)
Central Alamance 434 166514 26 184114 23 –20 –11.5 36.8 16.9
Caswell 425 22634 1 21960 1 3.1 0 36.8 22.5
Chatham 709 73127 12 82500 13 –4 8.3 26.1 24.9
Davidson 567 166358 23 178071 24 –2.5 4.3 19.6 18.6
Davie 267 42563 7 44800 8 8.6 14.3 13.1 21.8
Durham 298 316979 40 340727 47 9.3 17.5 54.0 14.0
Edgecombe 505 51984 8 47637 10 36.4 25 62.5 20.5
Forsyth 413 379216 72 396317 73 –3 1.4 43.0 16.6
Franklin 492 67625 8 80236 6 –36.8 –25 35.5 17.1
Granville 536 59979 9 62881 10 6 11.1 41.4 17.3
Guilford 657 532607 85 553023 88 –0.3 3.5 49.3 15.6
Halifax 731 50634 9 46342 11 33.5 22.2 59.1 21.6
Harnett 601 134336 17 145438 17 –7.6 0 38.0 13.4
Johnston 796 202692 34 249714 33 –21.2 –2.9 34.4 13.5
Lee 259 61208 11 67613 12 –1.2 9.1 41.0 16.9
Montgomery 502 27077 6 25516 7 23.8 16.7 34.9 21.8
Moore 706 98805 18 111001 21 3.8 16.7 19.1 24.0
Nash 543 94094 21 97793 21 –3.8 0 50.1 19.0
Northampton 536 19698 3 15867 2 –17.2 –33.3 57.6 28.5
Orange 401 147980 23 151635 29 23 26.1 29.5 15.7
Person 404 39436 6 39272 7 17.2 16.7 32.4 21.0
Randolph 790 143249 25 146358 26 1.8 4 21.1 18.1
Richmond 474 44888 11 42299 10 –3.5 –9.1 42.2 17.9
Rockingham 573 90617 18 91571 18 –1 0 25.6 20.8
Scotland 320 34751 7 33130 7 4.9 0 53.9 17.9
Stokes 456 45511 5 46036 10 97.7 100 7.3 22.5
Surry 536 71959 19 71249 18 –4.3 –5.3 16.8 20.6
Vance 254 44635 8 40712 9 23.3 12.5 59.0 18.8
Wake 857 1091273 183 1213377 220 8.1 20.2 39.1 12.5
Warren 429 19819 5 18803 5 5.4 0 57.3 26.9
Wilson 374 81392 14 78355 13 –3.5 –7.1 52.4 19.0
Yadkin 335 37481 5 37511 6 19.9 20 15.6 20.7
CRI Anson 537 24470 4 22059 4 10.9 0 52.8 19.9
Cabarrus 364 211597 37 248866 42 –3.5 13.5 36.8 13.4
Catawba 405 158687 38 168239 37 –8.2 –2.6 23.7 18.4
Cleveland 464 97519 24 101172 25 0.4 4.2 24.1 18.7
Gaston 364 222630 56 243242 54 –11.7 –3.6 28.9 16.3
Iredell 597 178332 36 207682 39 –7 8.3 23.2 16.4
Lincoln 307 84092 16 98348 18 –3.8 12.5 14.6 19.0
Mecklenburg 546 1093750 169 1190614 202 9.8 19.5 52.5 11.7
Rowan 524 141128 23 153047 24 –3.8 4.3 28.6 17.5
Stanly 395 62180 10 64286 13 25.7 30 18.8 19.0
Union 637 235830 37 263285 42 1.7 13.5 28.7 13.2
Eastern Beaufort 828 47056 9 43593 9 7.9 0 31.0 25.0
Bertie 741 19106 2 16739 4 128.3 100 63.5 24.3
Bladen 874 33151 8 28850 7 0.5 –12.5 46.0 23.2
Brunswick 855 136880 28 166886 29 –15.1 3.6 14.6 33.3
Camden 241 10676 1 11291 1 –5.4 0 13.4 16.0
Carteret 506 69438 17 70822 20 15.3 17.6 10.2 26.3
Chowan 233 14065 3 13896 3 1.2 0 37.3 27.3
Columbus 954 55819 12 49935 16 49 33.3 37.7 20.4
Craven 774 102338 24 105175 22 –10.8 –8.3 31.0 20.5
Cumberland 653 333430 47 343636 51 5.3 8.5 53.9 12.7
Currituck 526 27016 3 33670 2 –46.5 –33.3 11.2 17.2
Dare 1563 36607 10 37786 16 55 60 10.7 24.3
Duplin 819 58991 10 49683 12 42.5 20 46.6 19.7
Gates 346 11563 1 10534 1 9.8 0 33.7 22.0
Greene 266 21106 1 19939 3 217.6 200 48.0 16.9
Hertford 353 23878 7 19564 8 39.5 14.3 66.4 21.3
Hoke 392 54695 7 56269 7 –2.8 0 57.4 11.4
Hyde 1424 5026 1 4490 1 11.9 0 33.8 22.8
Jones 473 9613 4 9098 2 –47.2 –50 33.4 23.8
Lenoir 401 55990 15 53509 17 18.6 13.3 49.3 21.1
Martin 461 22660 5 20952 6 29.8 20 46.1 25.0
New Hanover 328 232256 41 242708 45 5 9.8 20.5 18.7
Onslow 767 196915 27 214782 24 –18.5 –11.1 29.1 9.7
Pamlico 337 12633 5 12139 6 24.9 20 23.9 30.7
Pasquotank 289 39583 8 40933 8 –3.3 0 43.0 18.1
Pender 933 62017 12 69485 14 4.1 16.7 22.0 18.0
Perquimans 247 13381 2 13209 2 1.3 0 25.6 28.4
Pitt 655 179575 30 177440 33 11.3 10 45.0 14.3
Robeson 949 131884 32 118737 28 –2.8 –12.5 74.2 15.8
Sampson 947 63345 8 59770 9 19.2 12.5 48.9 18.0
Tyrrell 389 4115 2 3324 2 23.8 0 43.7 25.5
Washington 348 11769 4 10304 4 14.2 0 53.7 27.4
Wayne 557 123237 28 117140 25 –6.1 –10.7 45.2 16.7
Western Alexander 264 37331 8 36464 6 –23.2 –25 11.4 20.6
Alleghany 236 11138 2 11464 2 –2.8 0 13.9 29.7
Ashe 429 27099 5 27196 6 19.6 20 7.7 27.0
Avery 247 17528 5 17395 6 20.9 20 10.7 23.0
Buncombe 660 259259 57 279331 69 12.4 21.1 15.1 20.8
Burke 515 90405 18 89581 20 12.1 11.1 18.7 21.2
Caldwell 474 82026 20 81884 18 –9.8 –10 11.2 21.2
Cherokee 455 28369 6 29361 7 12.7 16.7 7.2 31.3
Clay 221 11124 4 11924 3 –30 –25 7.4 32.3
Graham 302 8461 2 7718 1 –45.2 –50 13.7 24.8
Haywood 555 61890 9 64109 13 39.4 44.4 6.7 25.4
Henderson 375 116500 22 121587 27 17.6 22.7 18.1 26.0
Jackson 494 43600 7 43308 10 43.8 42.9 18.5 20.4
Macon 516 35274 9 38539 8 –18.6 –11.1 12.1 28.9
Madison 451 21665 5 21453 5 1 0 5.1 23.1
McDowell 441 45465 8 44601 8 1.9 0 12.2 20.7
Mitchell 222 14996 4 14751 6 52.5 50 6.8 25.5
Polk 239 20668 3 19660 2 –29.9 –33.3 10.9 32.1
Rutherford 566 66775 11 65035 13 21.3 18.2 14.3 22.1
Swain 541 14249 2 13857 1 –48.6 –50 36.4 19.7
Transylvania 381 34173 5 33230 6 23.4 20 9.5 30.8
Watauga 313 56034 10 57751 11 6.7 10 9.8 16.7
Wilkes 757 68563 9 66315 11 26.4 22.2 11.9 22.7
Yancey 313 17873 3 18606 3 –3.9 0 6.9 26.5

Table note. NCDHHS = North Carolina Department of Health and Human Services
a Based on 2023 ACS survey. Counties with > 24% of population aged 65 years or older within the upper quartile and therefore may be considered to represent the “highest concentration” category.
b NIH-Designated Populations with Health Disparities responding as single race to one of the following: American Indian or Alaska Native, Asian, Black or African American, Hispanic or Latino, and Native Hawaiian or Pacific Islander. Those of Middle Eastern or North African descent, while included in the NIH-designated populations, were not characterized in the 2023 ACS survey. Counties with > 45% racial minorities (upper quartile) may be considered to represent the “highest concentration” category.